
Unlock insights and blogs to navigate property and tenant management successfully.

The fastest, most comprehensive tenant report—delivered instantly.
Unlock insights and blogs to navigate property and tenant management successfully.
The fastest, most comprehensive tenant report—delivered instantly.
Get credit and financial data from both credit bureaus to see the full picture
Easy, mobile friendly, and comprehensive online rental application form
We will contact your tenant’s references and share a recording and summary of the call
Search eviction court records from Openroom, CanLII, and SOQUIJ
AI-powered scan of income documents to detect signs of tampering or fraud
Confirm a tenant’s identity with AI-powered ID verification and liveness check
Unlock insights and blogs to navigate property and tenant management successfully.
Free Lease Agreement Forms for each province in one place
Conversations on real estate trends and property management strategies
Local tools and resources to help you manage your rental property successfully
Learn how to solve renting challenges from our experts
Articles on how to navigate the in-app SingleKey experience
A look at Canada’s average renter profile, affordability, and risk trends based SingleKey’s Q3 2025 rental applications
Get approved for any lease by showing landlords you’re a risk free tenant
Stand out from other applicants with the background check trusted by landlords
Affordable tenant insurance to protect renter's property and liability
Build your credit with every rent payment
The fastest, most comprehensive tenant report—delivered instantly.
Unlock insights and blogs to navigate property and tenant management successfully.
Free Lease Agreement Forms for each province in one place
Conversations on real estate trends and property management strategies
Local tools and resources to help you manage your rental property successfully
Learn how to solve renting challenges from our experts
Articles on how to navigate the in-app SingleKey experience
A look at Canada’s average renter profile, affordability, and risk trends based SingleKey’s Q3 2025 rental applications
Get approved for any lease by showing landlords you’re a risk free tenant
Stand out from other applicants with the background check trusted by landlords
Affordable tenant insurance to protect renter's property and liability
Build your credit with every rent payment
We analyzed hundreds of thousands of rental applications and data points across Canada to determine the average renter profile, affordability, and risk signals throughout Q3 2025.
Applicant Overview

32
2
27%

$2,063
$2,708
$67,536
$109,056
Full-time
72.5%
Part-time
6.4%
Student
5.2%
Self-employed
4.7%
Other
4.3%
Unemployed
3.6%
Retired/Pension
3.4%
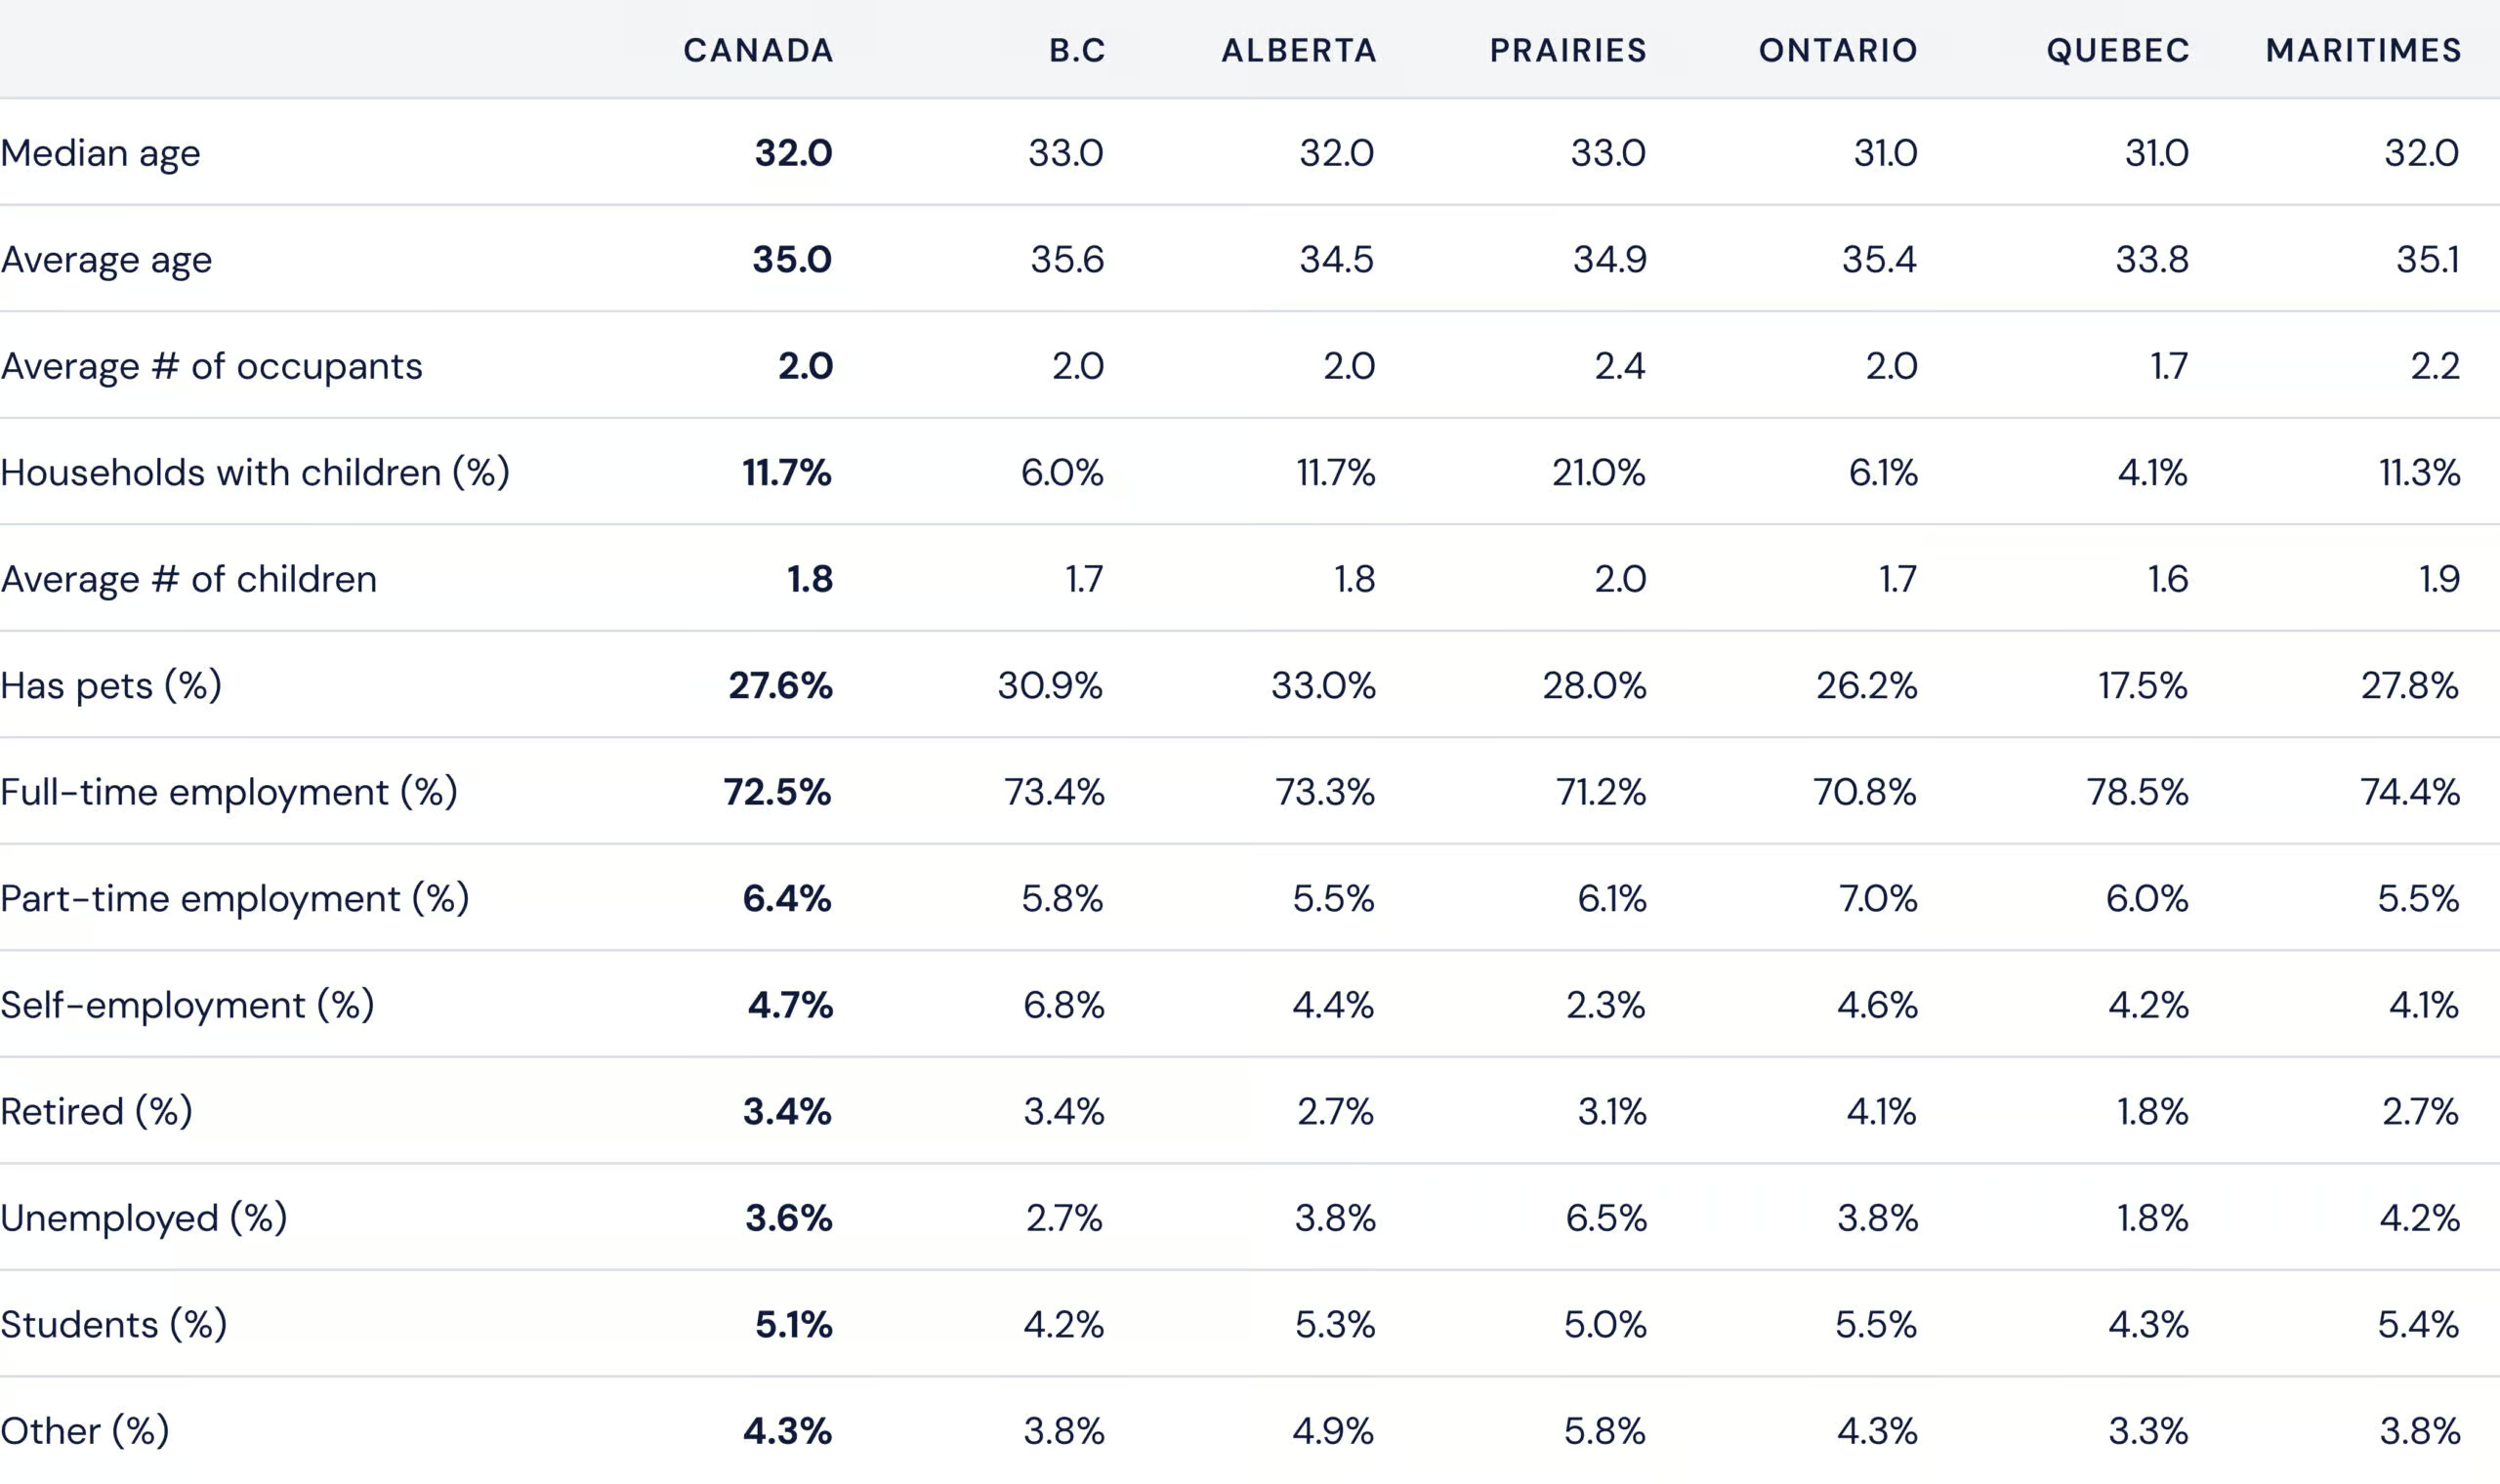
Canada’s renters have a median age of 32, are mostly full-time employed, and increasingly settled. About 12% have children and 28% have pets, reflecting a demographic renting later into life while starting families.
CANADA
CANADA
B.C
ALBERTA
PRAIRIES
ONTARIO
QUEBEC
MARITIMES
Median age
32.0
33.0
32.0
33.0
31.0
31.0
32.0
Average age
35.0
35.6
34.5
34.9
35.4
33.8
35.1
Average # of occupants
2.0
2.0
2.0
2.4
2.0
1.7
2.2
Has children (%)
11.7%
6.0%
11.7%
21.0%
6.1%
4.1%
11.3%
Average # of children
1.8
1.7
1.8
2.0
1.7
1.6
1.9
Has pets (%)
27.6%
30.9%
33.0%
28.0%
26.2%
17.5%
27.8%
Full-time employment (%)
72.5%
73.4%
73.3%
71.2%
70.8%
78.5%
74.4%
Part-time employment (%)
6.4%
5.8%
5.5%
6.1%
7.0%
6.0%
5.5%
Self-employment (%)
4.7%
6.8%
4.4%
2.3%
4.6%
4.2%
4.1%
Retired (%)
3.4%
3.4%
2.7%
3.1%
4.1%
1.8%
2.7%
Unemployed (%)
3.6%
2.7%
3.8%
6.5%
3.8%
1.8%
4.2%
Students (%)
5.1%
4.2%
5.3%
5.0%
5.5%
4.3%
5.4%
Other (%)
4.3%
3.8%
4.9%
5.8%
4.3%
3.3%
3.8%
CANADA
VANCOUVER
CALGARY
WINNIPEG
TORONTO
MONTREAL
HALIFAX
Median age
33.0
34.0
34.1
34
32.6
32.8
Average age
33.1
34.0
34.1
34.0
32.6
32.8
Average # of occupants
1.9
2.0
2.4
1.8
1.6
2.2
Has children (%)
6.1%
11.7%
21.4%
6.1%
4.1%
11.3%
Average # of children
1.6
1.7
2.0
1.4
1.6
1.9
Has pets (%)
22.1%
28.2%
24.4%
15.2%
12.7%
17.6%
Full-time employment (%)
72.8%
76.3%
70.3%
73.7%
79.0%
75.9%
Part-time employment (%)
7.0%
5.4%
6.6%
5.4%
6.8%
6.2%
Self-employment (%)
6.5%
5.1%
1.7%
5.9%
3.7%
5.1%
Retired (%)
1.3%
2.0%
2.6%
2.4%
1.5%
1.5%
Unemployed (%)
3.4%
3.2%
7.4%
3.2%
1.5%
3.3%
Students (%)
7.8%
4.7%
3.5%
7.1%
5.7%
6.9%
Other (%)
1.0%
3.4%
7.9%
2.3%
1.8%
1.1%
CANADA
CANADA
B.C
ALBERTA
PRAIRIES
ONTARIO
QUEBEC
MARITIMES
Rent price ($)
$2,063
$2,490
$1,869
$1,683
$2,159
$1,623
$1,890
Household income ($)
$109,057
$125,516
$108,248
$91,058
$110,800
$89,522
$98,765
Personal income ($)
$67,537
$78,033
$68,057
$52,705
$67,410
$59,895
$61,672
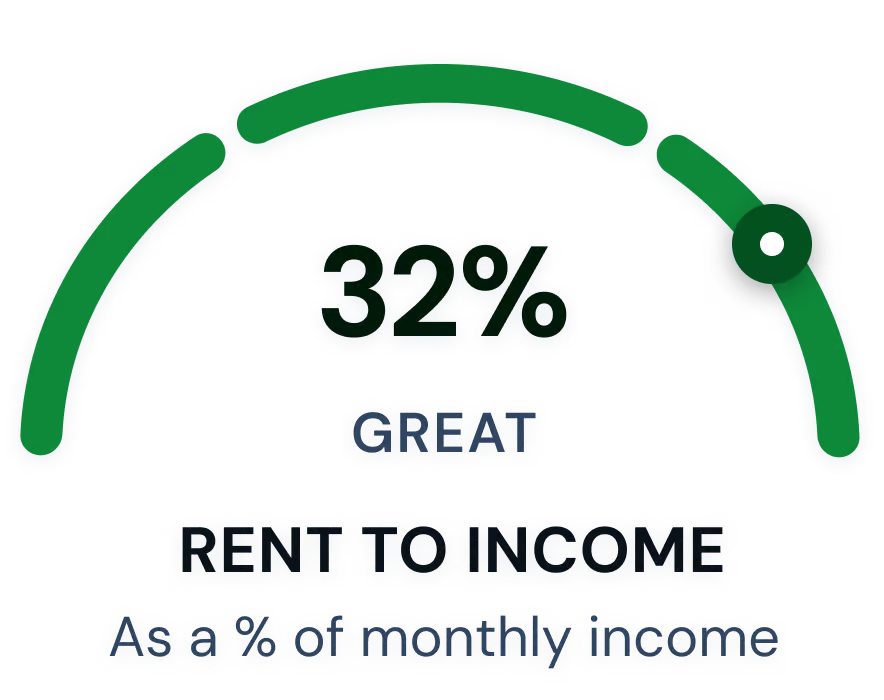
Rent-to-income (%)
32.6%
33.9%
29.6%
30.2%
33.6%
32.9%
32.6%
Monthly debt payments ($)
$645
$678
$689
$529
$645
$579
$544
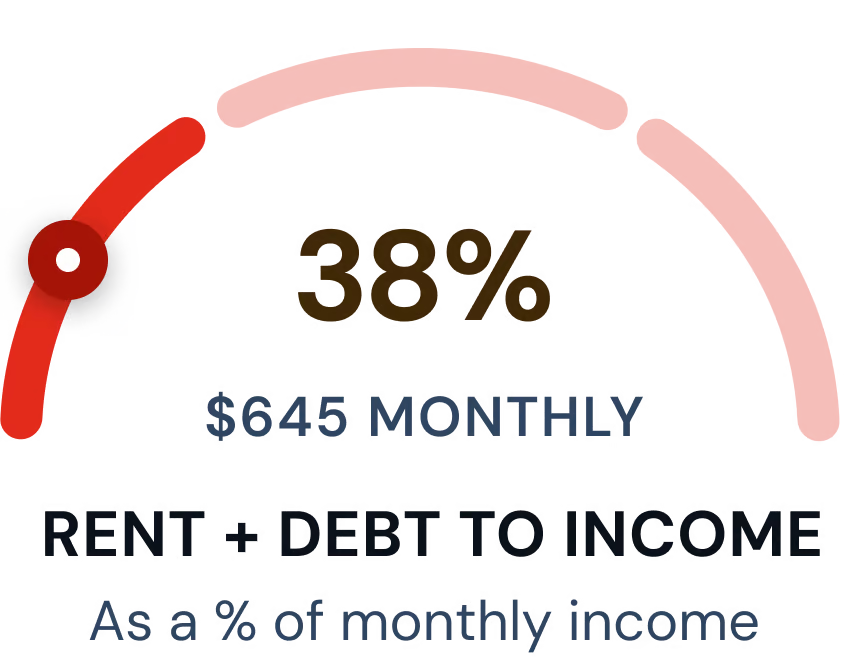
Rent + debt-to-income (%)
38.6%
40.0%
36.5%
35.3%
39.2%
39.4%
38.5%
CANADA
VANCOUVER
CALGARY
WINNIPEG
TORONTO
MONTREAL
HALIFAX
Rent price ($)
$2,891
$2,028
$1,713
$2,581
$1,605
$2,145
Household income ($)
$146,194
$116,390
$107,703
$142,346
$89,748
$112,449
Personal income ($)
$92,721
$77,224
$63,526
$94,370
$61,506
$71,539
Rent-to-income (%)
35.6%
27.7%
26.0%
30.6%
32.3%
34.2%
Monthly debt payments ($)
$650
$681
$526
$693
$456
$413
Rent + debt-to-income (%)
41.6%
33.4%
31.0%
34.2%
37.3%
37.4%
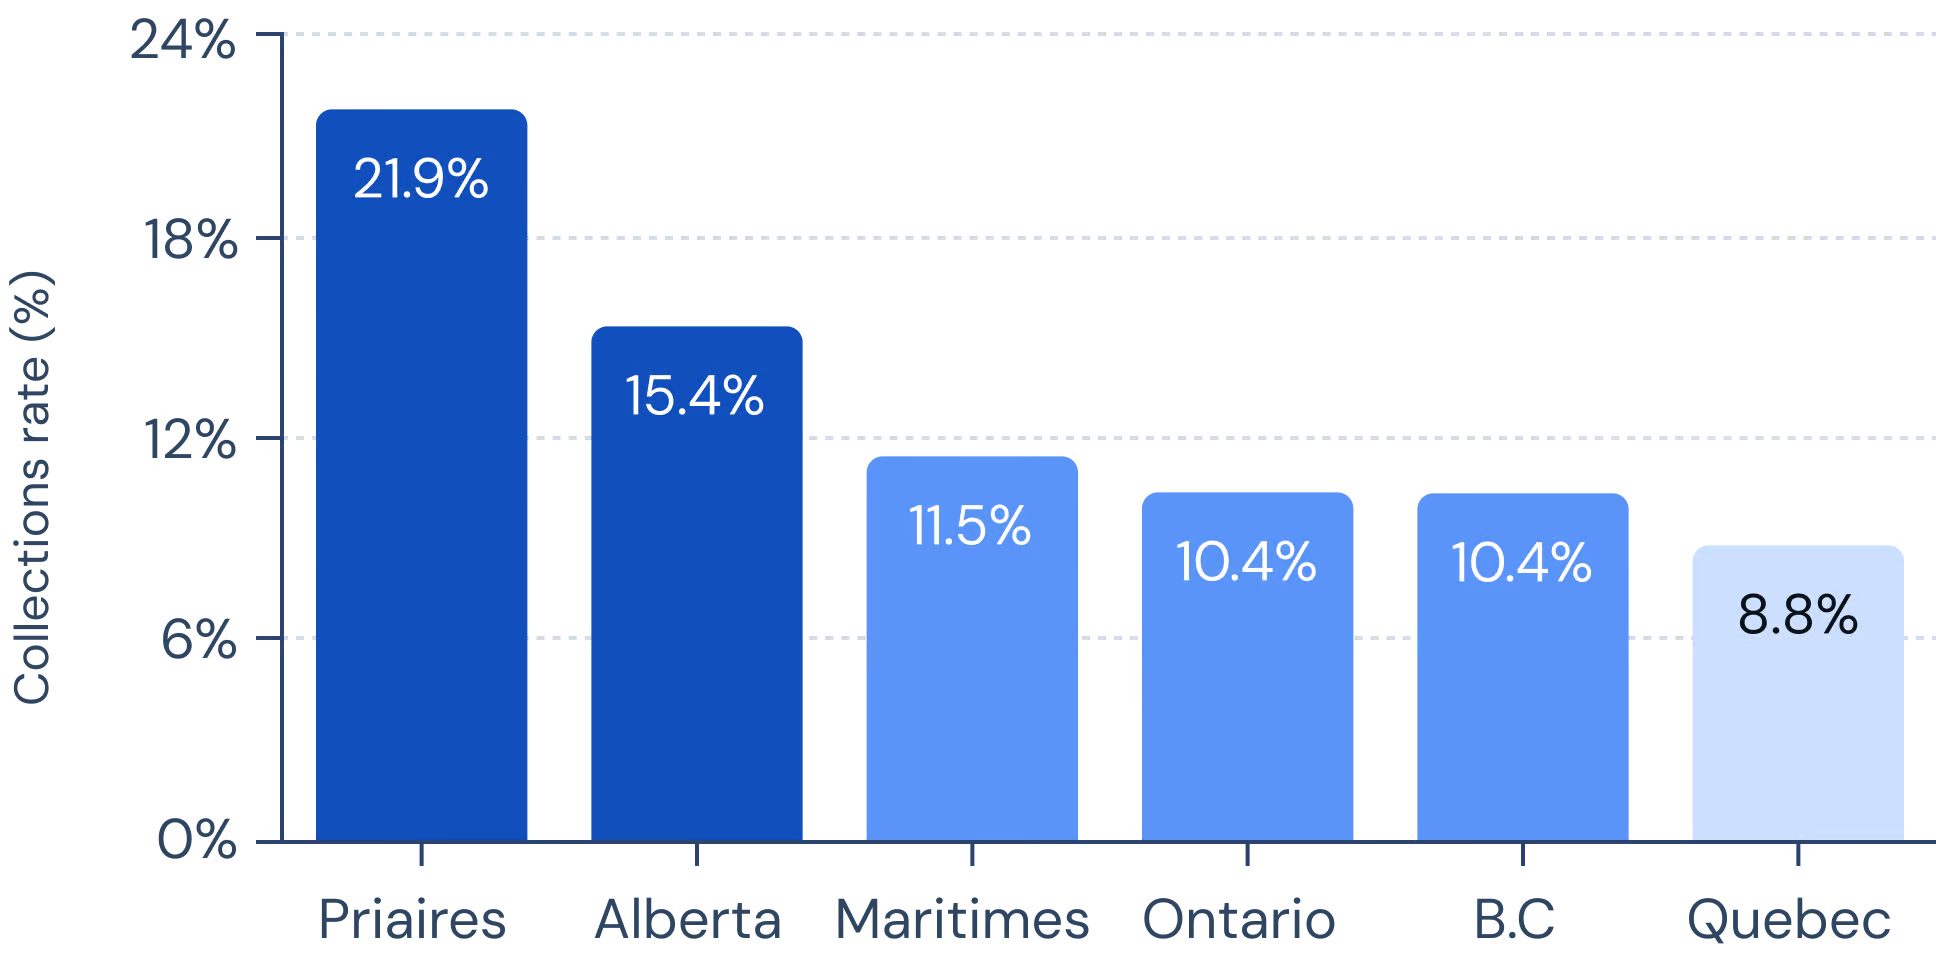
Rent is more affordable in central Canada, however these renters have higher collection rates, bankruptcies, and lower credit scores, indicating higher financial instability.
CANADA
CANADA
B.C
ALBERTA
PRAIRIES
ONTARIO
QUEBEC
MARITIMES
Credit score
693
702
682
653
701
683
677
Rent-to-income (%)
32.6%
33.9%
29.6%
30.2%
33.6%
32.9%
32.6%
Debt-to-income (%)
7.9%
7.6%
9.0%
7.1%
7.6%
8.3%
6.7%
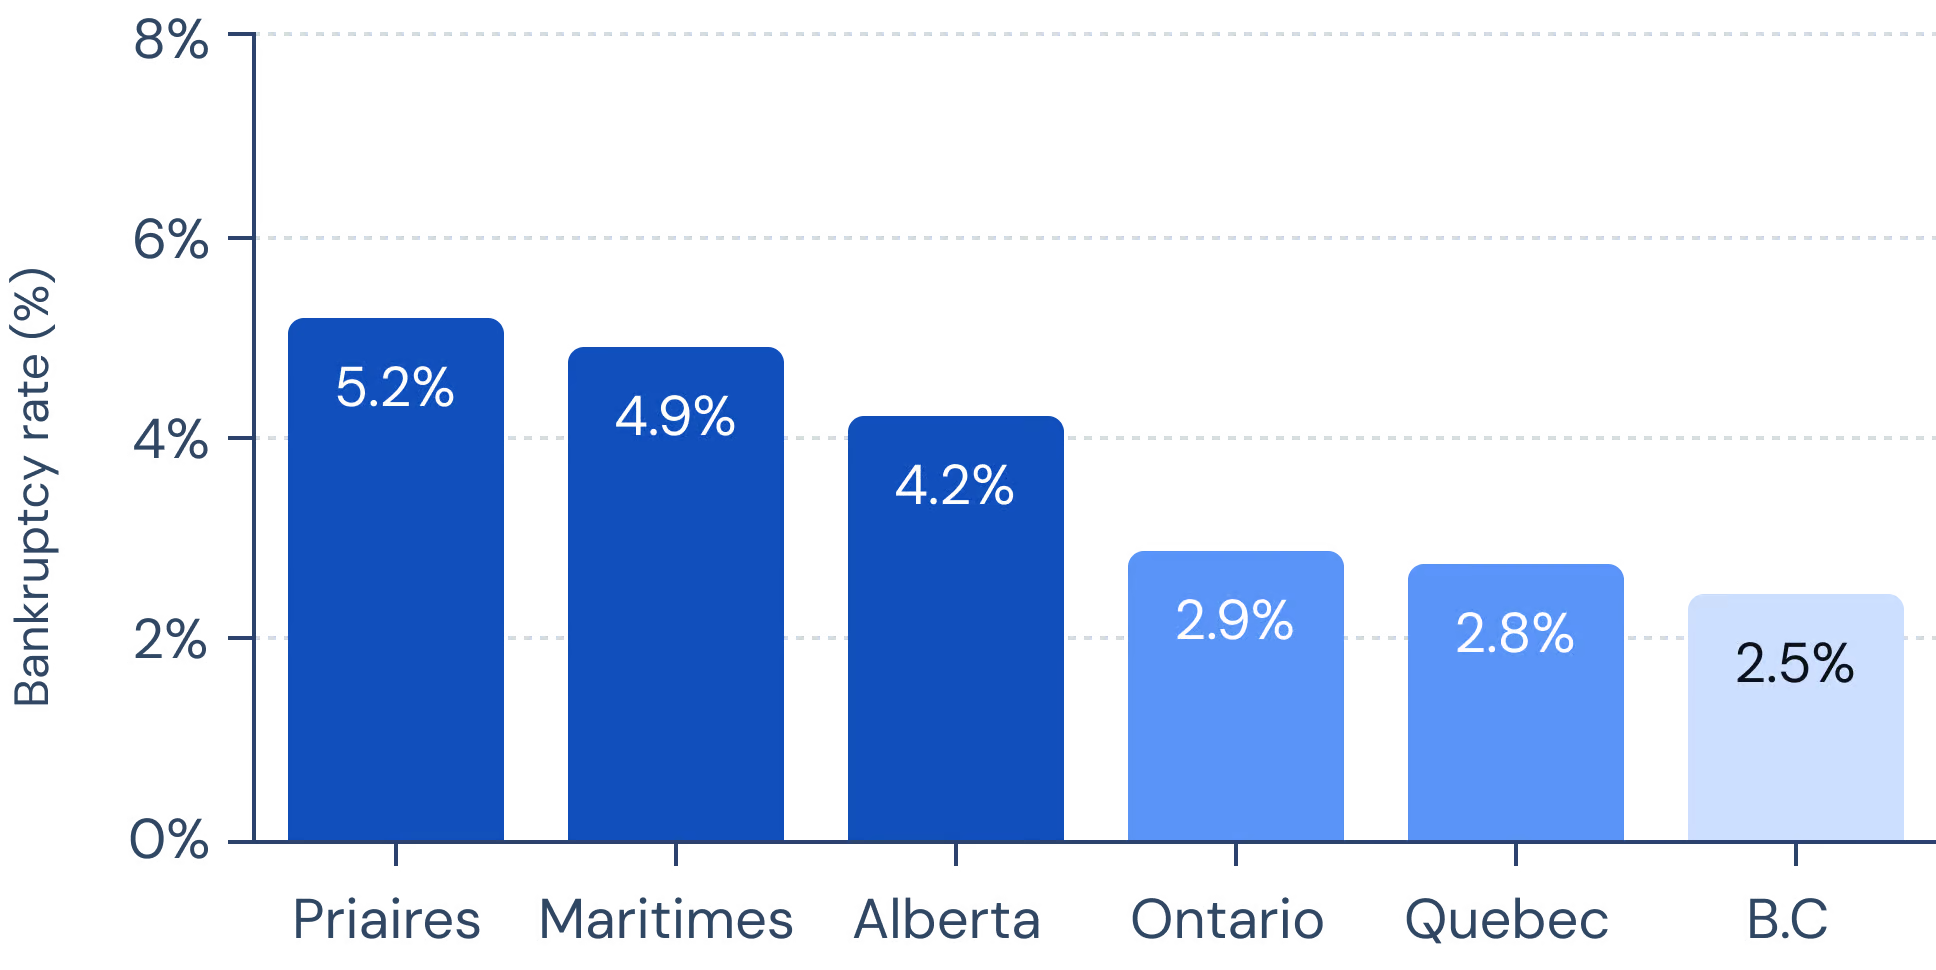
Bankruptcies (%)
3.3%
2.5%
4.2%
5.2%
2.9%
2.8%
4.9%
Collections (%)
11.6%
10.4%
15.4%
21.9%
10.4%
8.8%
11.5%
Application declined (%)
18.0%
25.2%
14.7%
18.3%
17.7%
21.7%
16.7%
CANADA
VANCOUVER
CALGARY
WINNIPEG
TORONTO
MONTREAL
HALIFAX
Credit score
731
703
655
735
688
705
Rent-to-income (%)
35.6%
27.7%
26.0%
30.6%
32.3%
34.2%
Debt-to-income (%)
7.2%
7.8%
6.7%
5.7%
6.4%
4.1%
Bankruptcies (%)
2.1%
2.9%
3.9%
1.1%
2.1%
1.7%
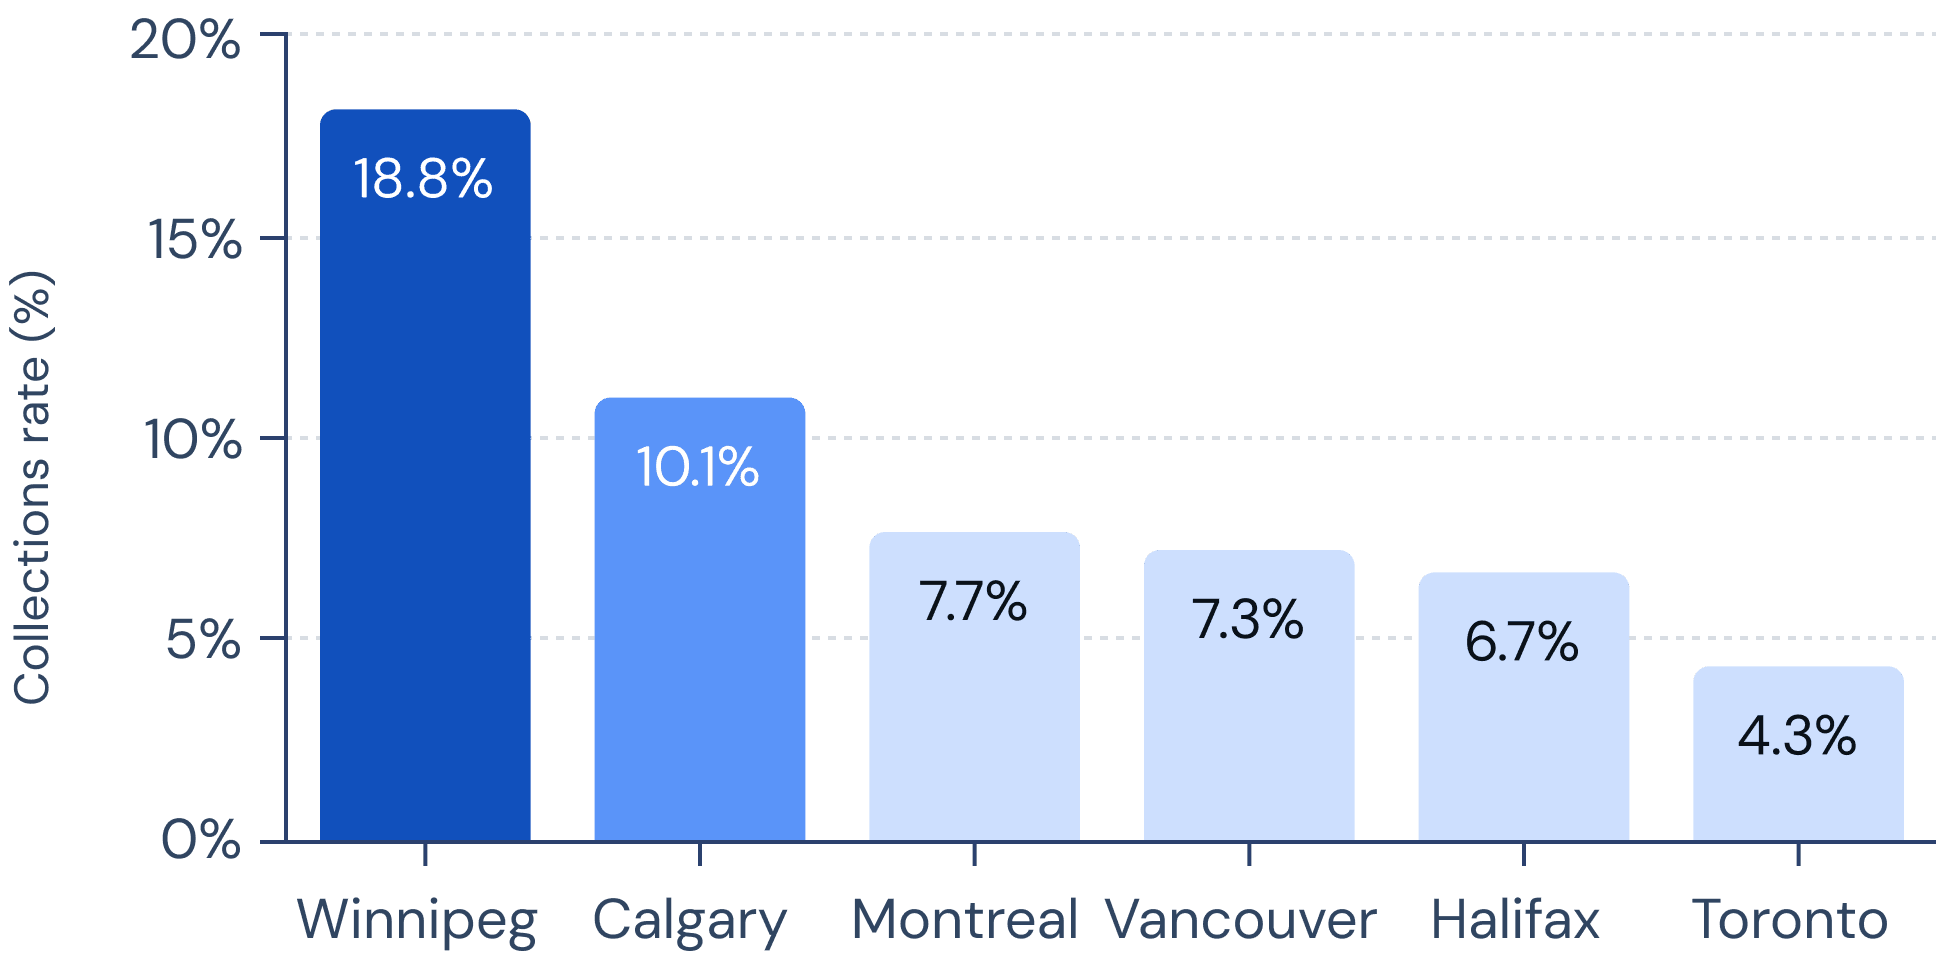
Collections (%)
7.3%
10.1%
18.9%
4.3%
7.7%
6.7%
Application declined (%)
13.8%
9.5%
31.3%
13.5%
14.4%
5.0%
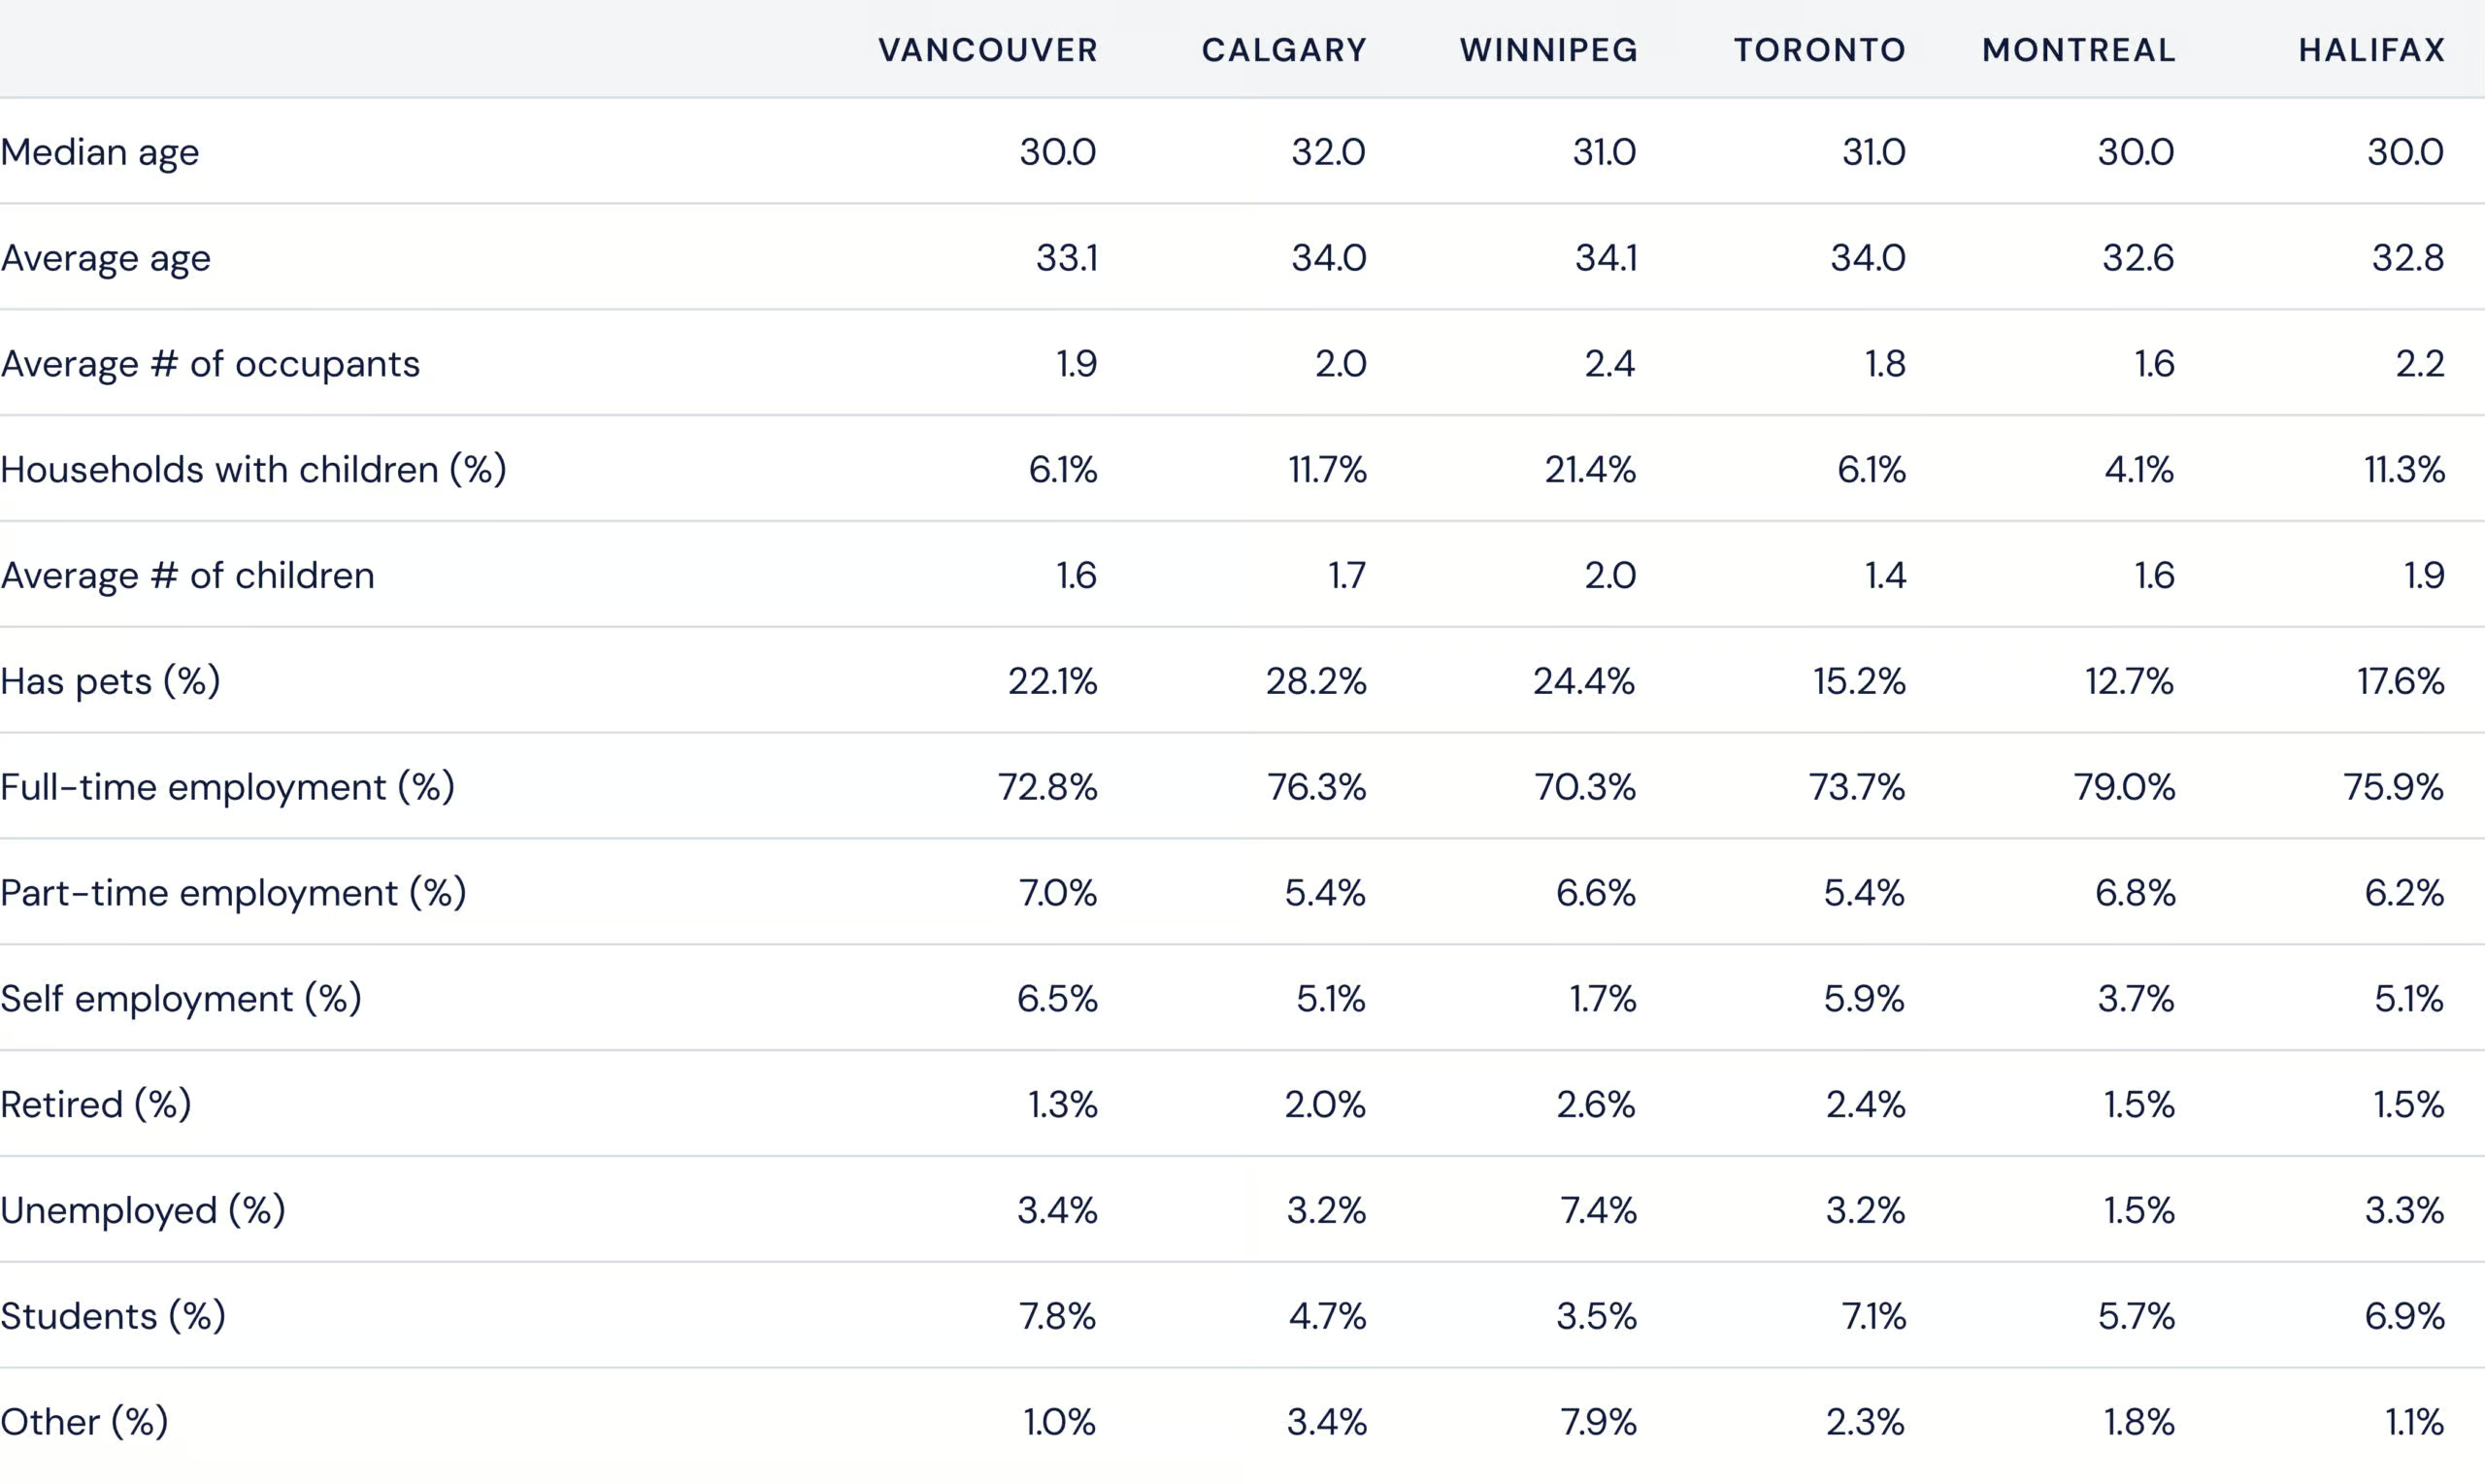
In Winnipeg, 21.4% of renters have children, and the city’s renters have the oldest median age in Canada (34.1). This indicates that Winnipeg offers greater affordability for renters seeking to start families.
The traditional model of "rent in 20s, buy before kids" is breaking down - renters are now in their mid-30s, and whether they have families depends more on regional affordability than age.
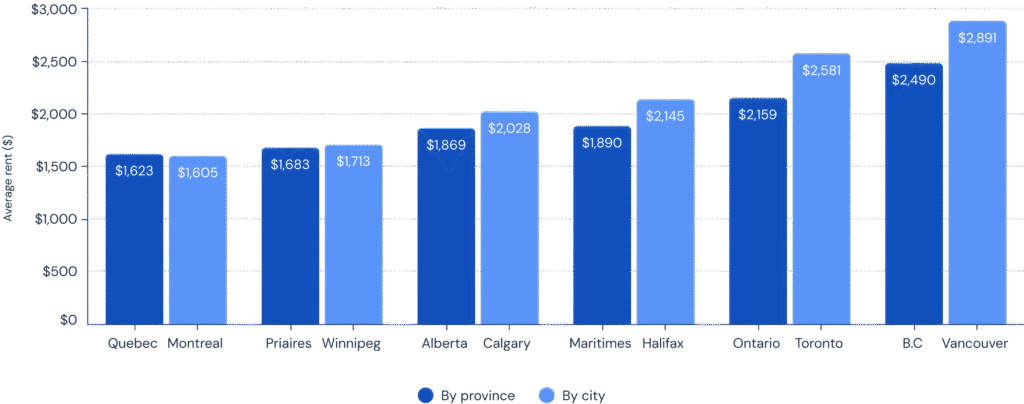
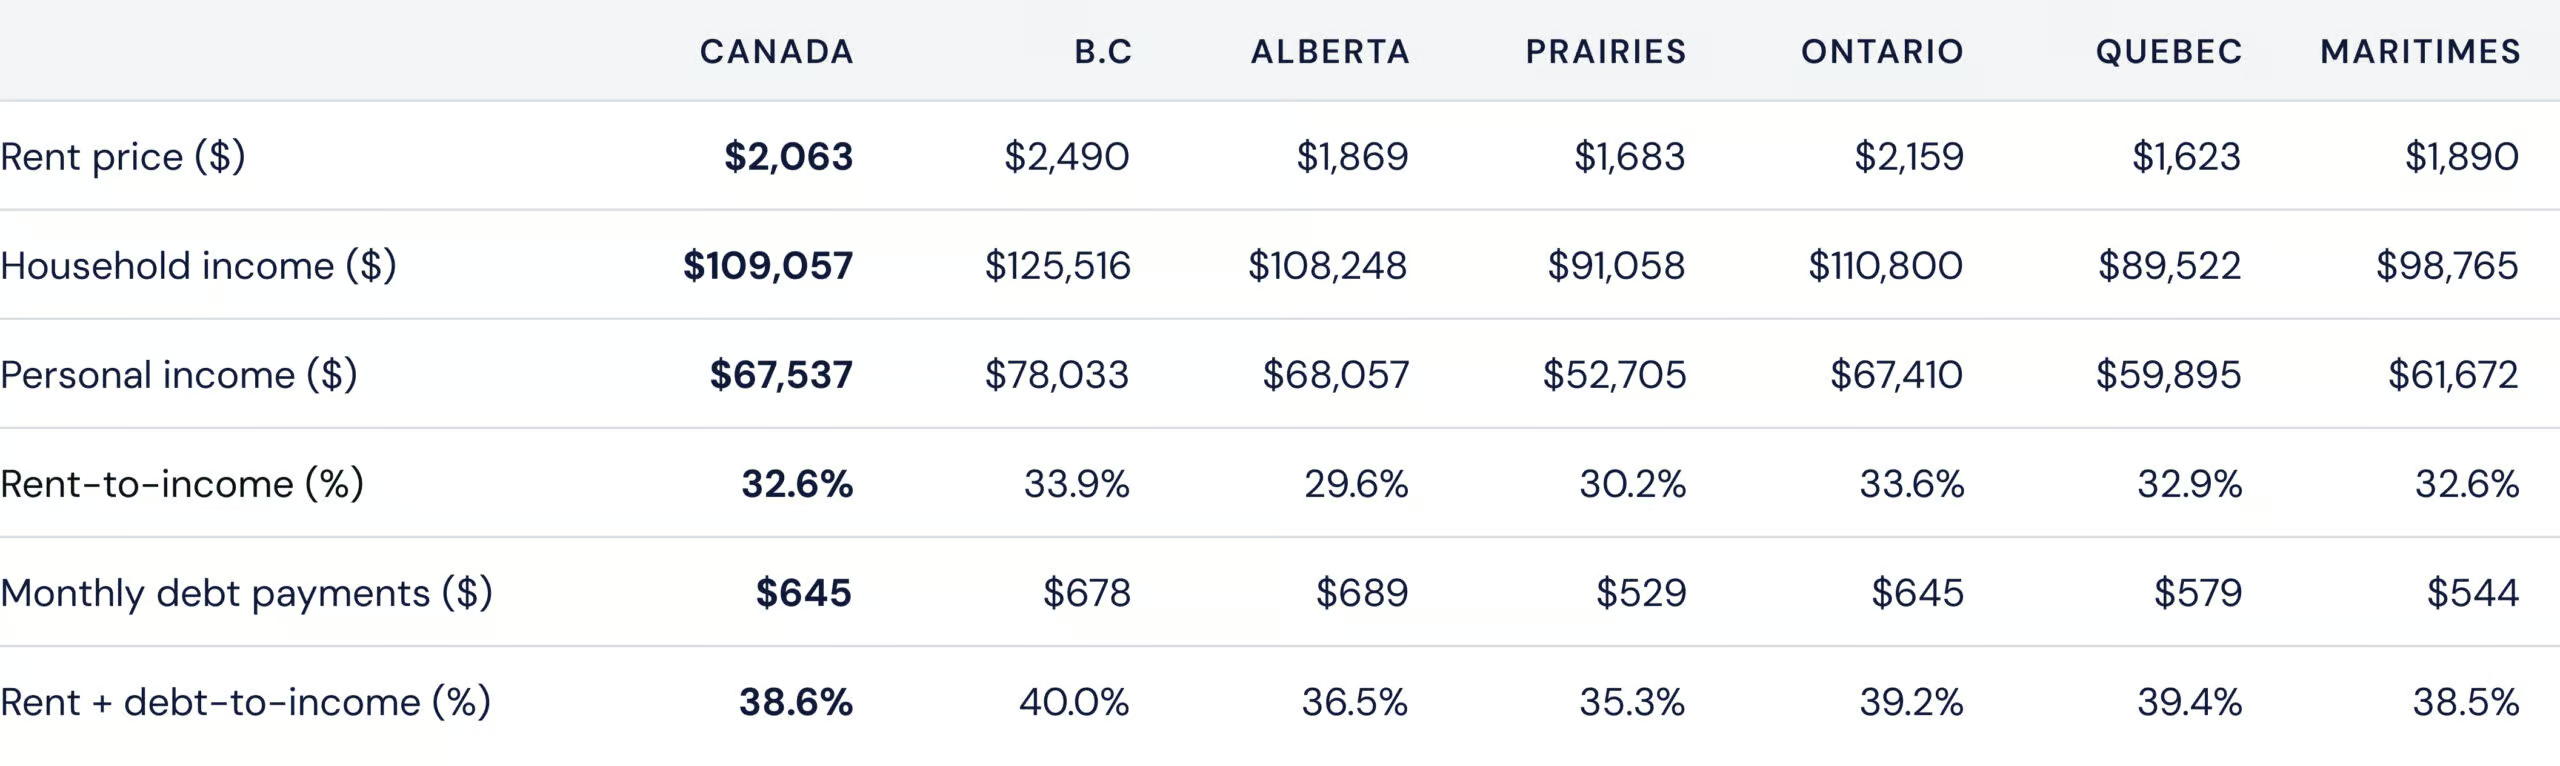
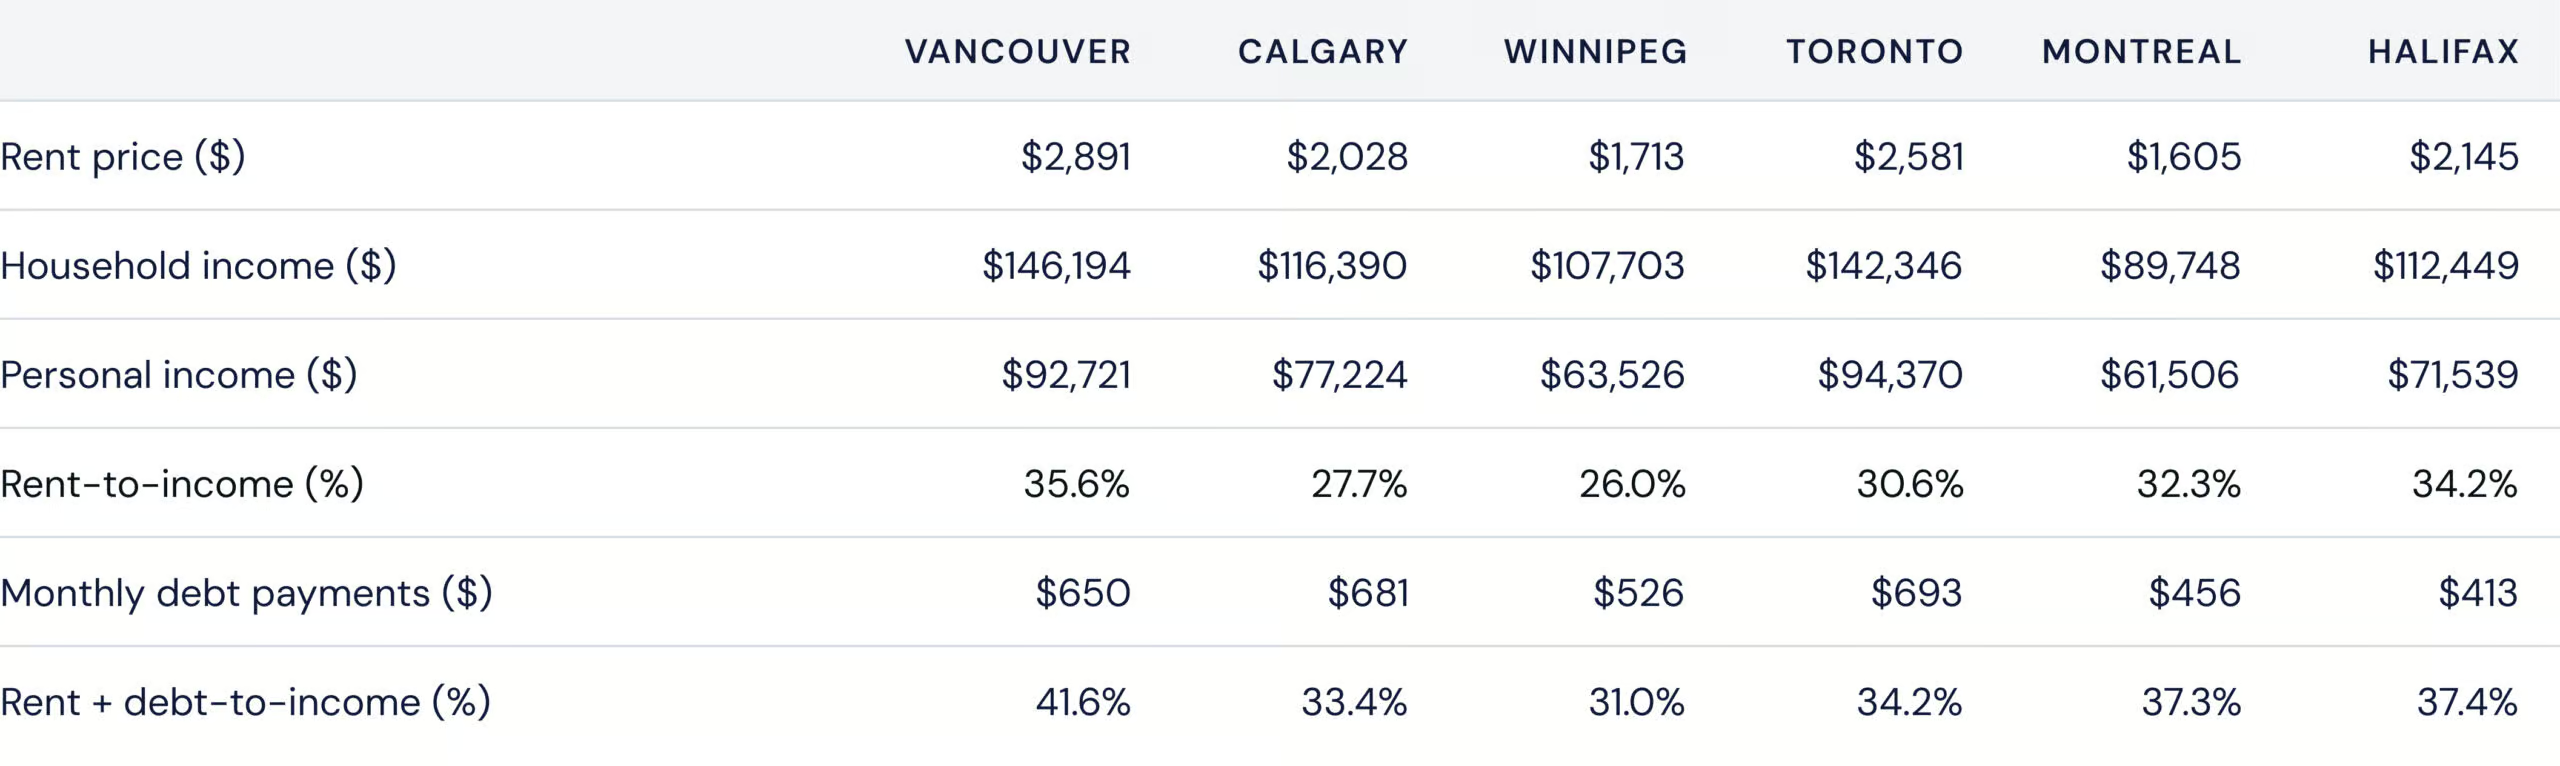
Rents are exceeding 30% of gross income across most of the country. Currently, Halifax and Montreal tenants face the most affordability strain, seeing lower incomes yet higher rent prices on average. Toronto and Vancouver appear less affordable overall, yet renters have higher incomes on average, which offsets higher rent costs.
Vancouver and Toronto continue to lead as Canada’s most expensive rental markets, while Quebec and the Prairies remain the last bastions of relative affordability.
Higher rents tend to coincide with older renter populations, while provinces with lower rents (like the Prairies and Quebec) see a higher share of households with children.
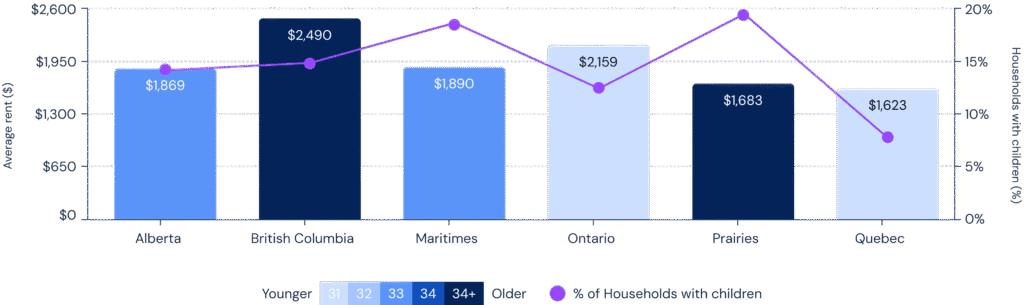
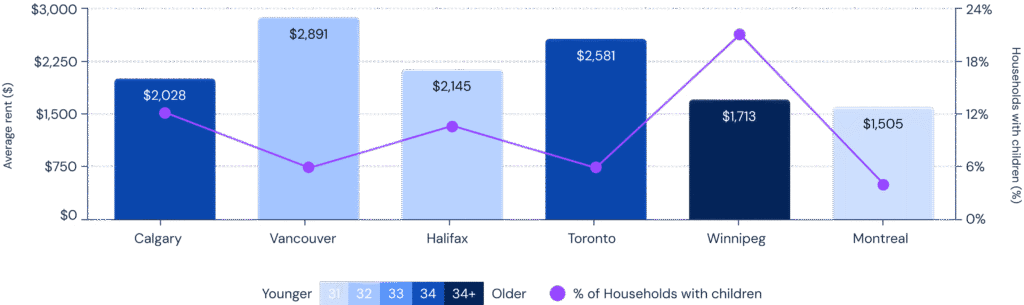
How to read this chart: Bars show average rent by age group, with darker shades for older renters. The purple line represents the share of households with children, showing where family renters are most concentrated.
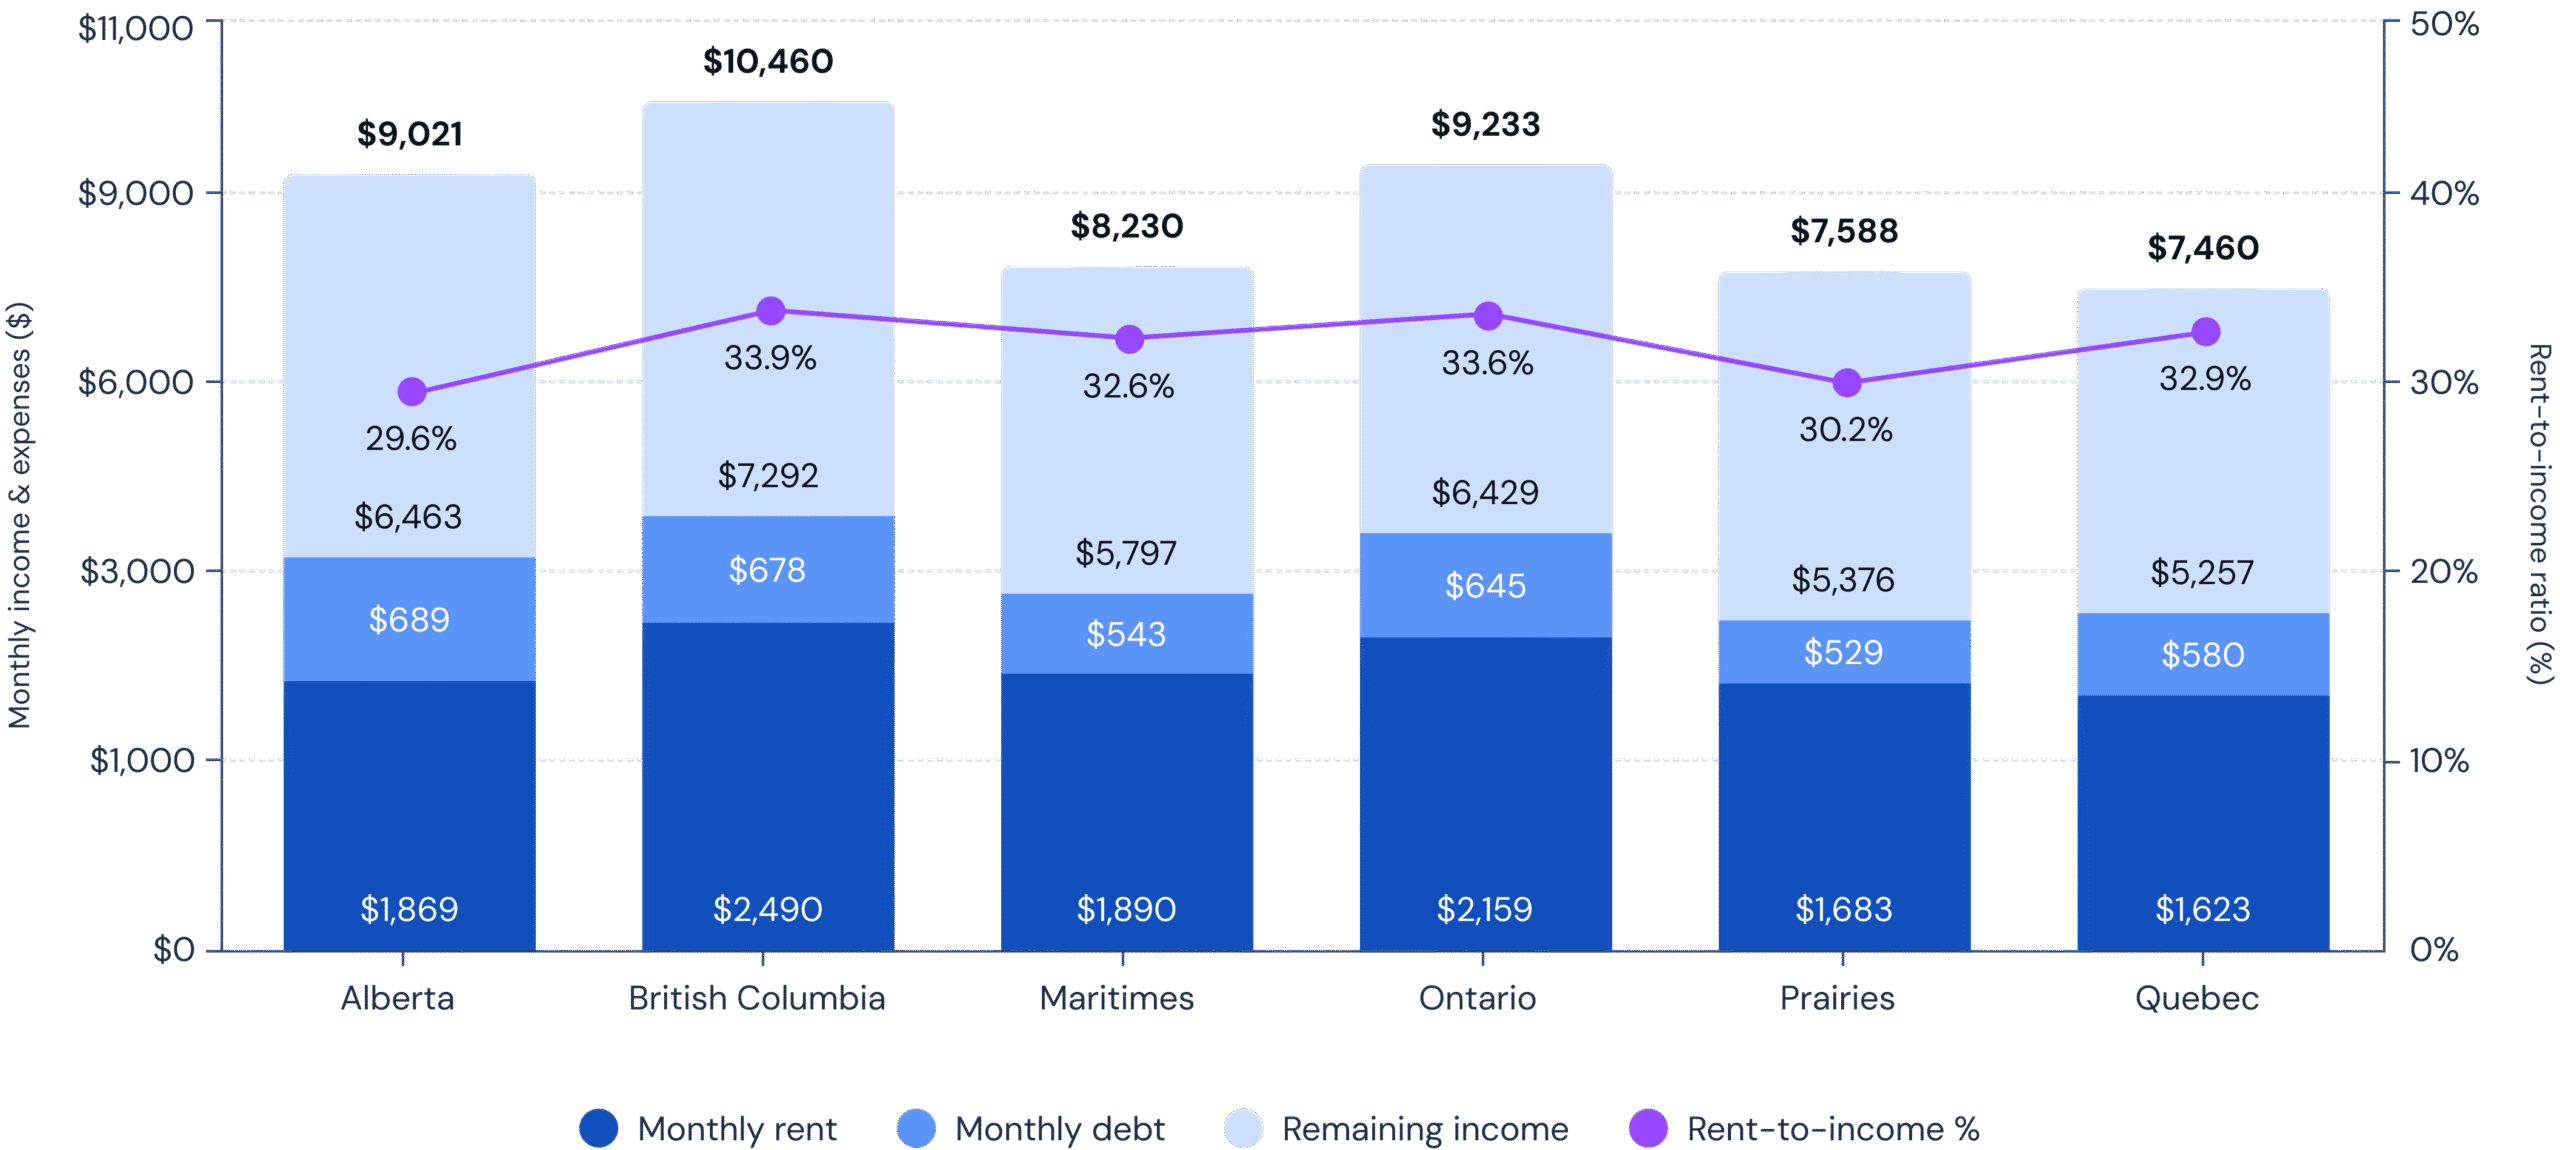
Despite regional income differences, renters across Canada face similar affordability pressures. Rent consumes about one-third of household income, and when combined with debt, many households are left with limited disposable income.
By province

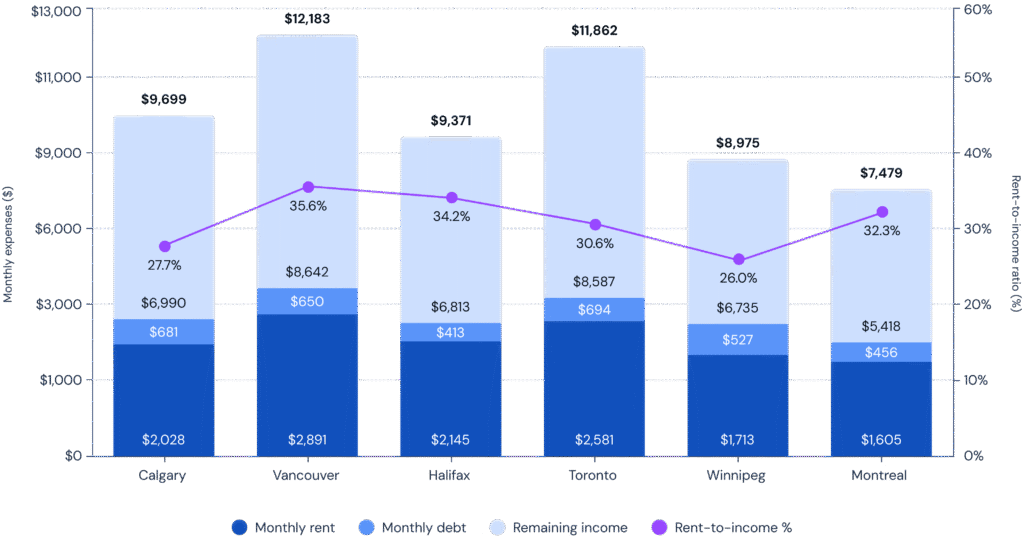
How to read this chart: The bar chart shows monthly expenses of rent, debt, and a renter’s income after these expenses are subtracted. The top line number shows the monthly gross household income before taxes. The purple line tracks the rent-to-income ratio, highlighting where housing costs take up more of renters’ pay.
Affordability improves in dual-income households: rent’s share drops by nearly eight points when measured against household rather than personal income, allowing these renters to better absorb high rental costs.
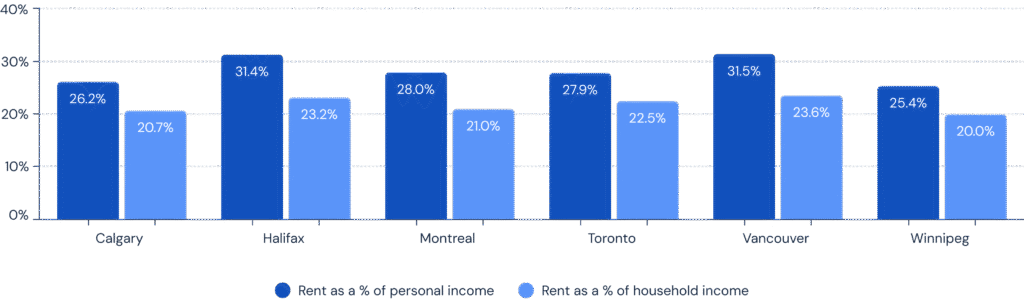
How to read this chart: Each city shows rent as a share of personal income and household income. The gap between the two reflects how renting is more affordable on two incomes instead of one. All income is measured as gross monthly income before taxes.
While over half (53%) of renters earn under $60,000 annually, an increasing share fall into higher income brackets — with many earning well above $100,000. This shift points to a more affluent renter base overall, even as rent continues to consume roughly one-third of household income.
$67,536
$109,056

28.4%
25.1%
19.2%
10.7%
8.1%
3.1%
5.5%
Province
AVG RENT
MONTHLY INCOME
RTI
British Columbia
$2,490
$10,460
33.9%
Alberta
$1,869
$9,021
29.6%
Prairies
$1,683
$7,588
30.2%
Ontario
$2,159
$9,233
33.6%
Quebec
$1,623
$7,460
32.9%
Maritimes
$1,890
$8,230
32.6%
Province
AVG RENT
MONTHLY INCOME
RTI
Vancouver
$2,891
$12,183
35.6%
Calgary
$2,028
$9,699
27.7%
Winnipeg
$1,713
$8,975
26.0%
Toronto
$2,581
$11,862
30.6%
Montreal
$1,605
$7,479
32.3%
Halifax
$2,145
$9,371
34.2%
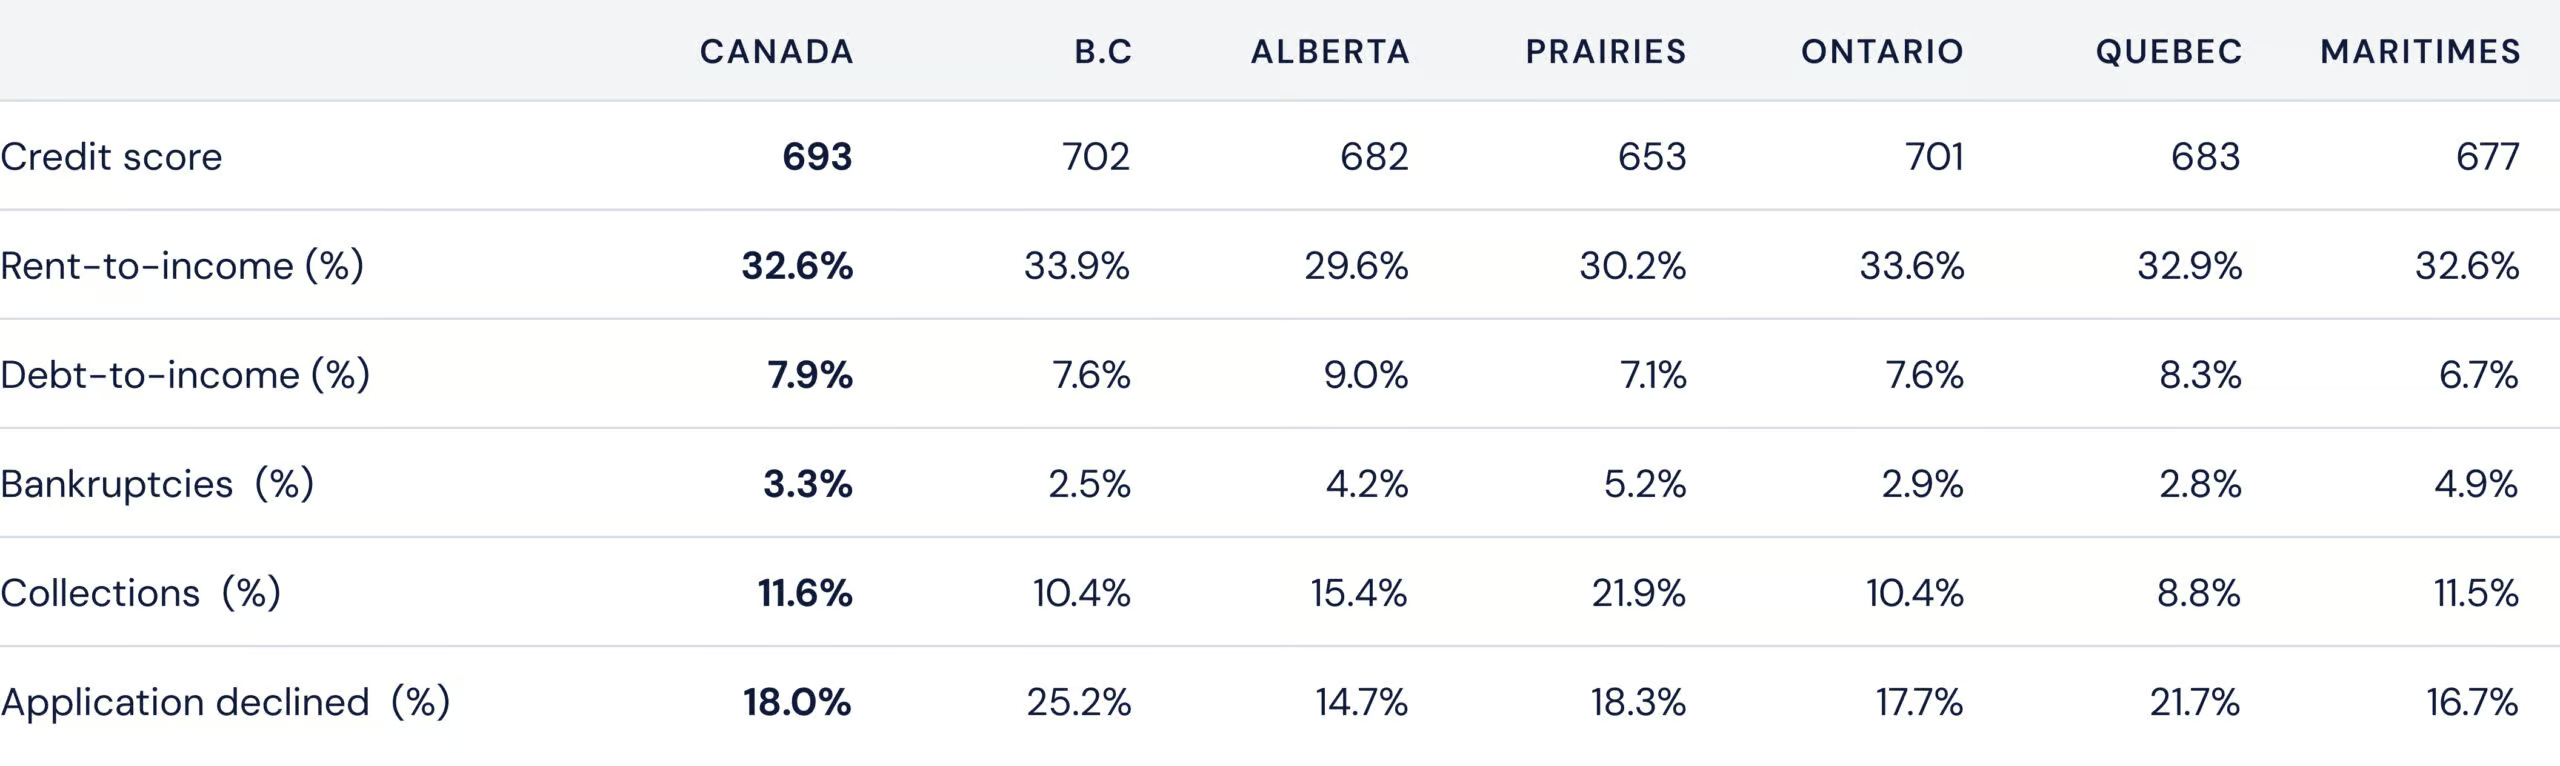
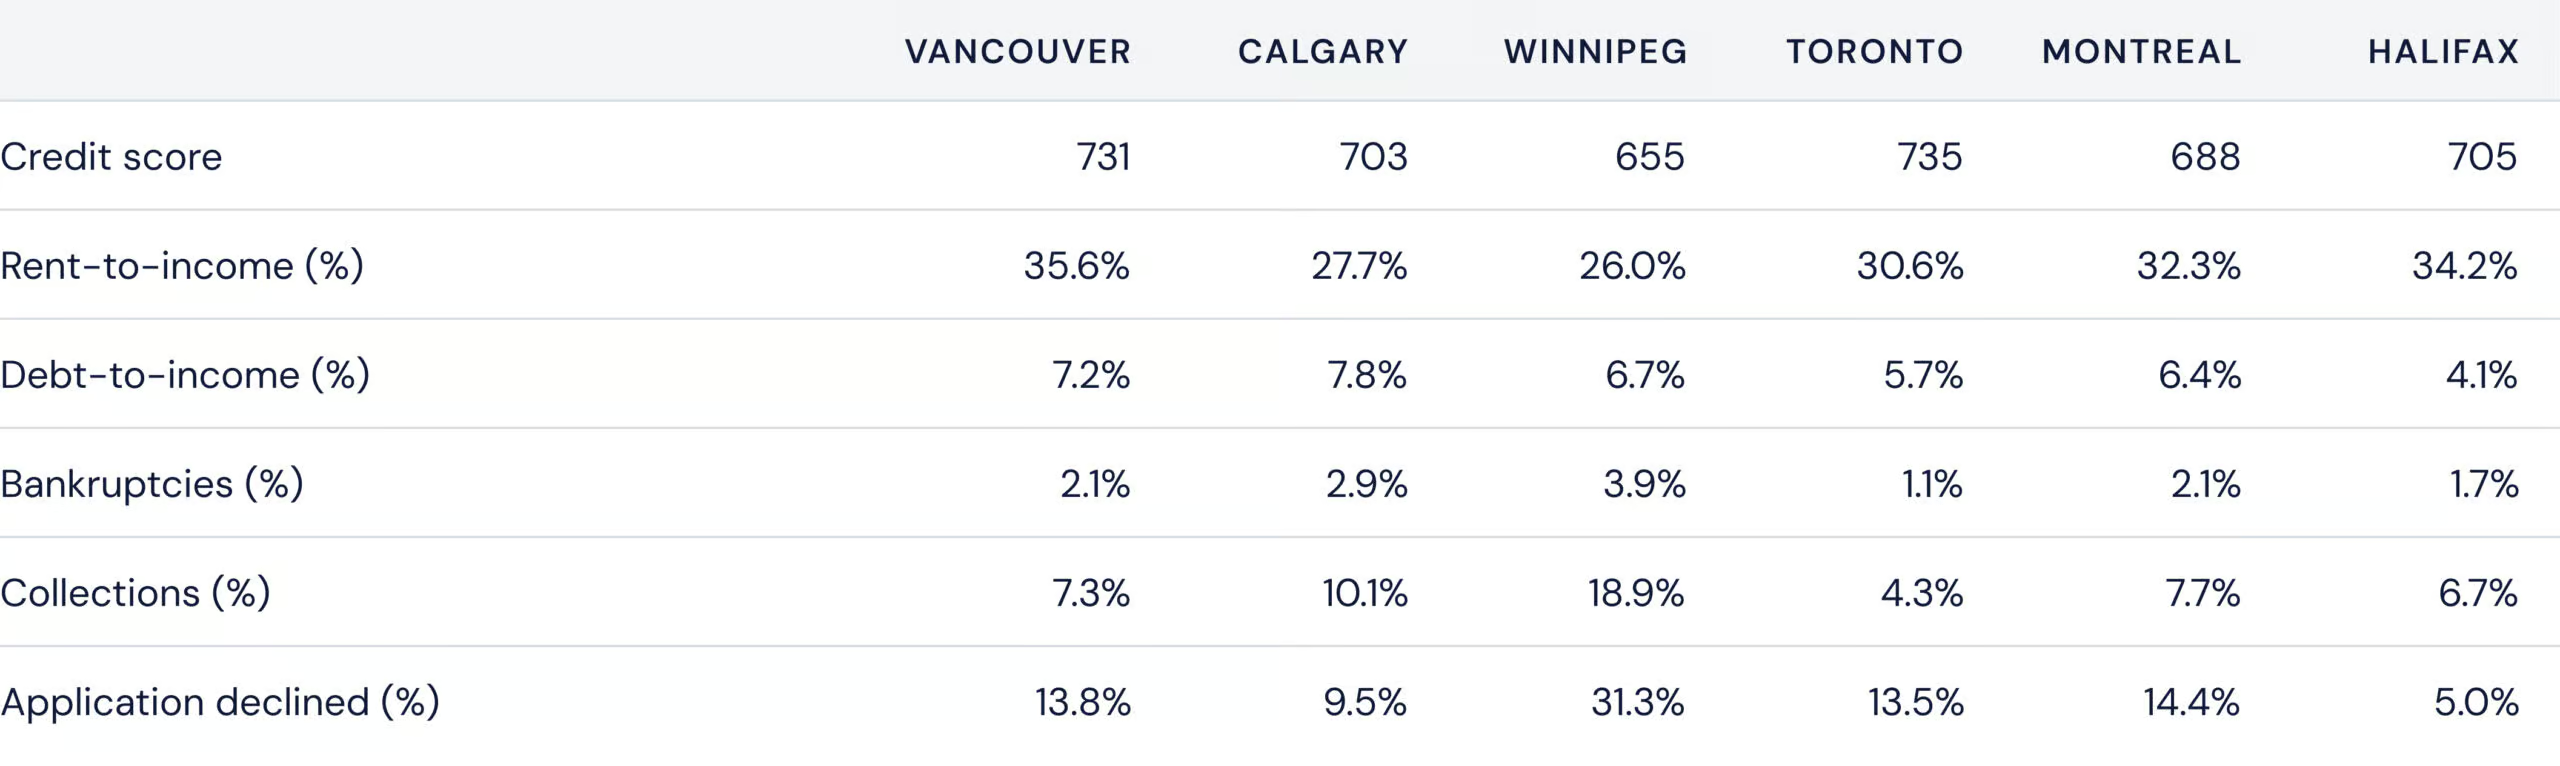
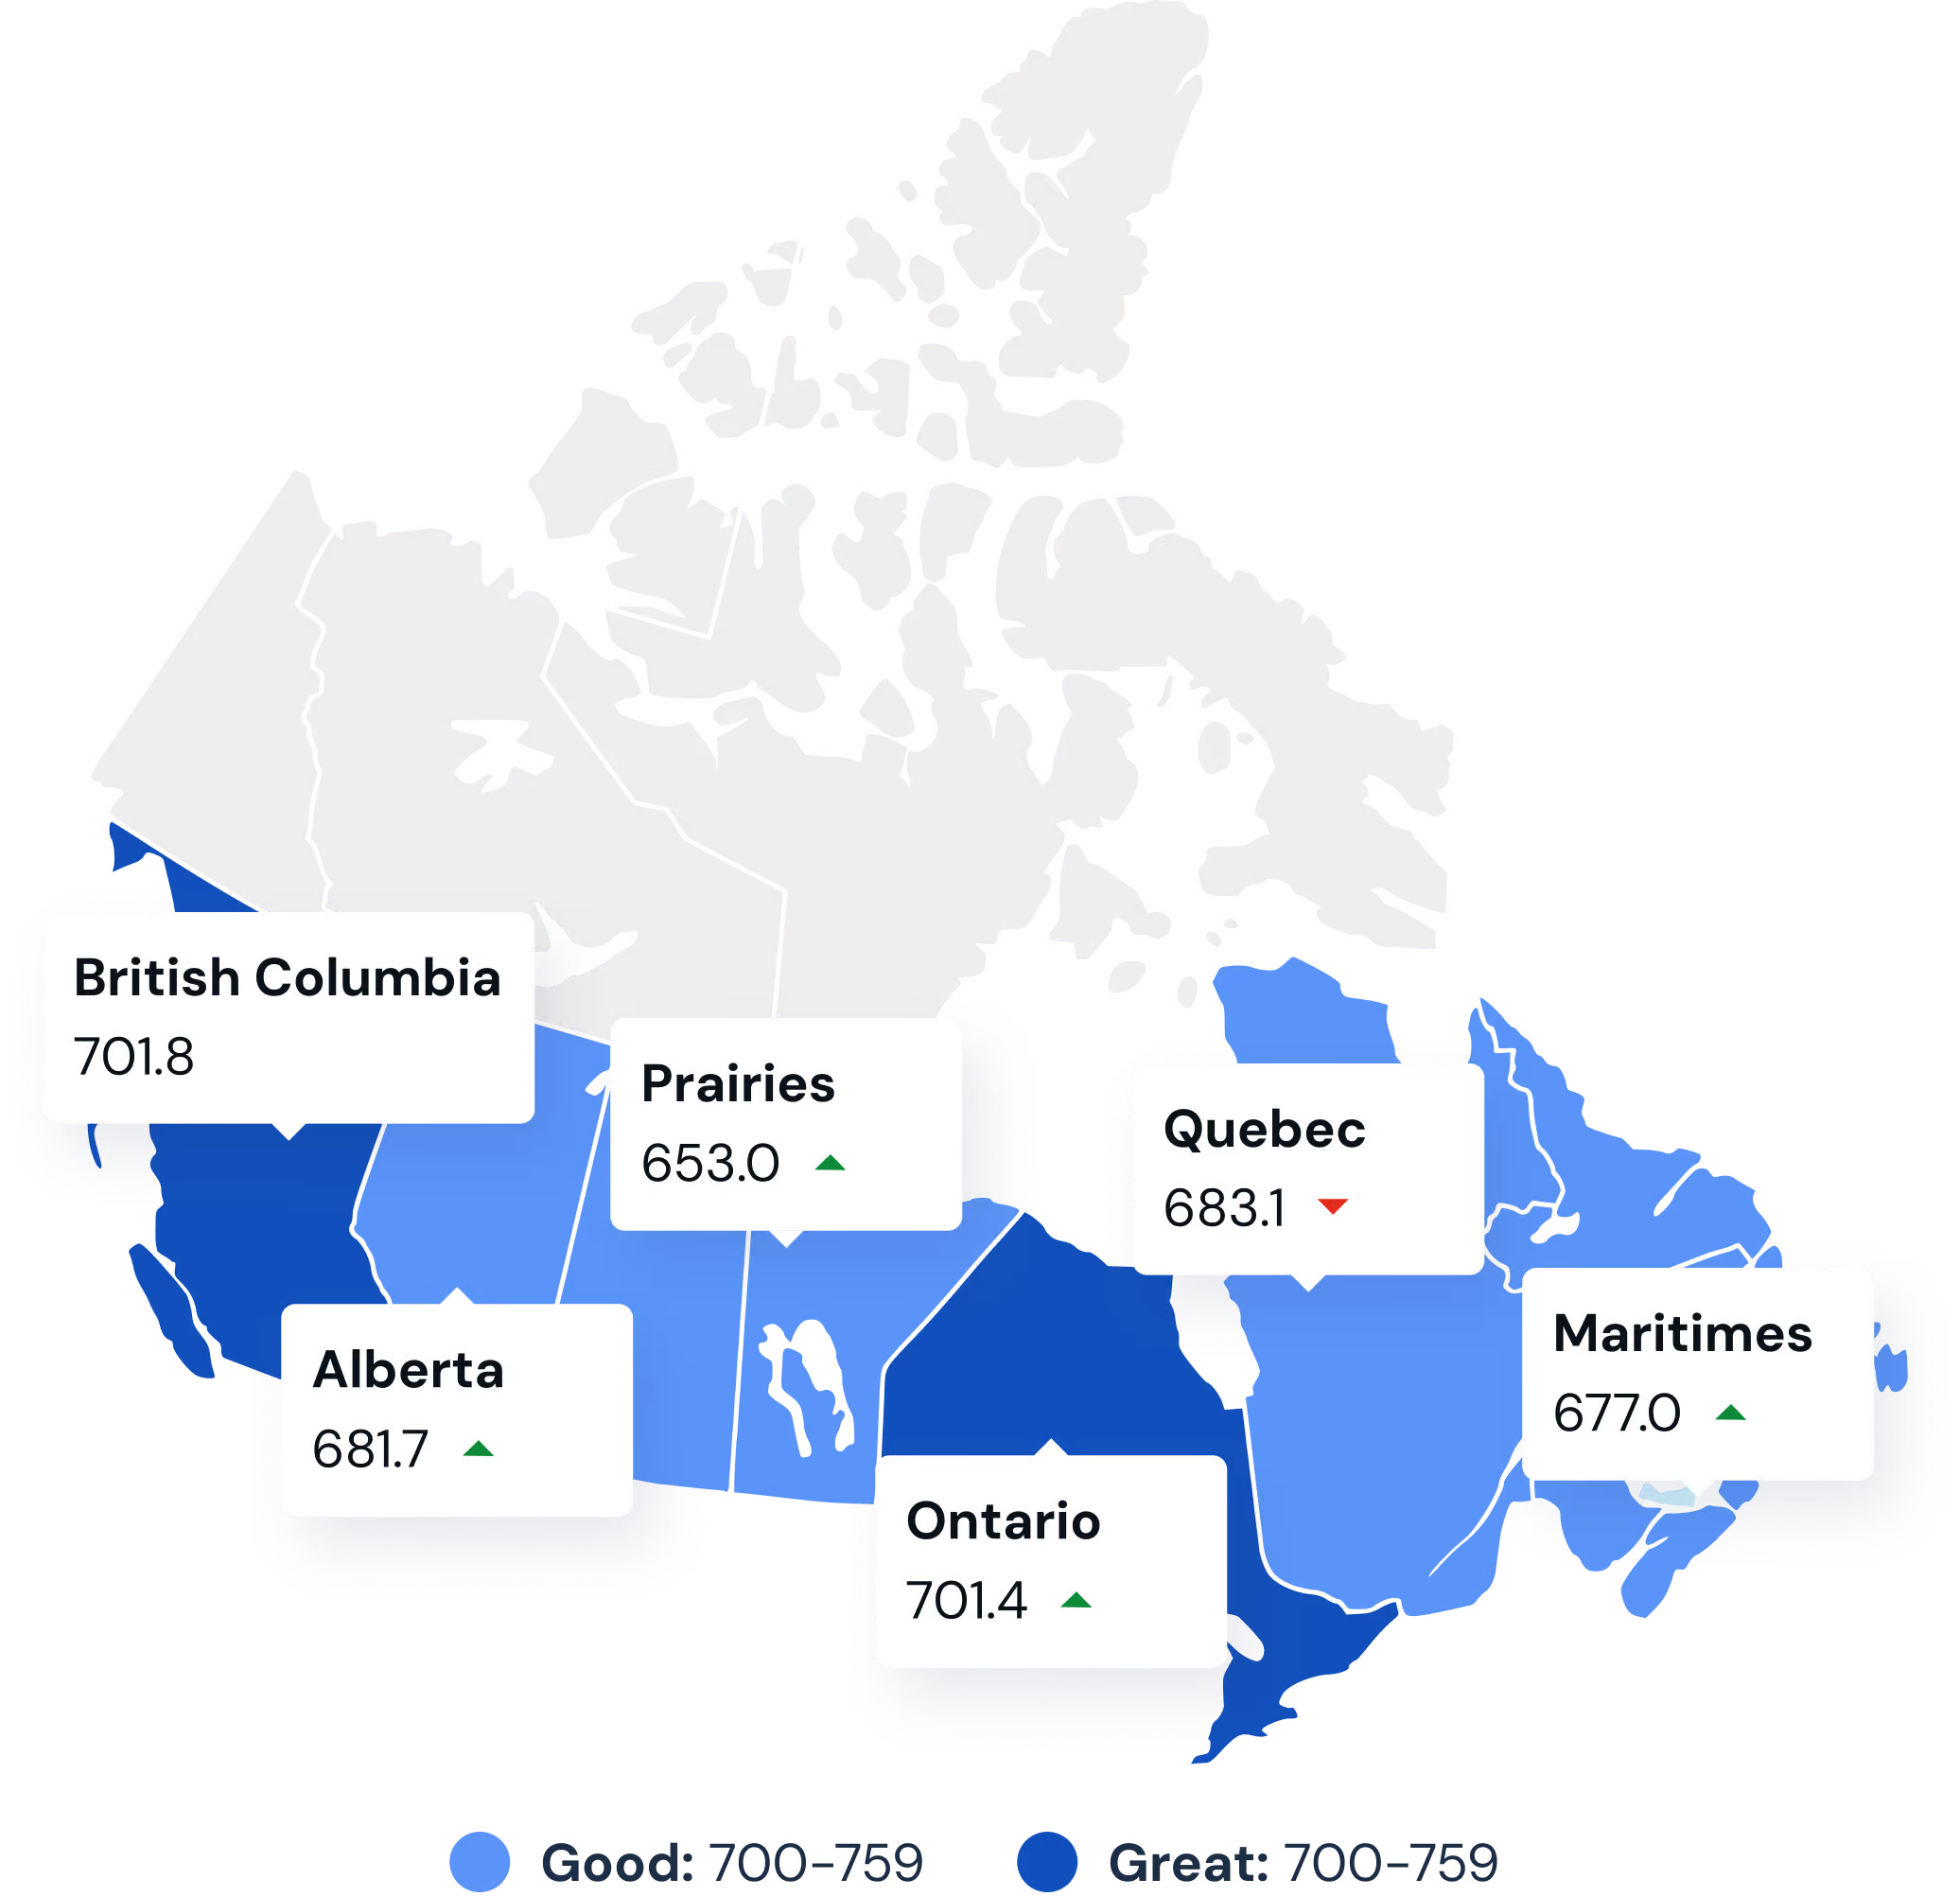
On average, renters fall in the good credit range, with a large share in great to excellent. Year over year, we are seeing credit strength improve over time across the provinces, while this trend is reversed in larger cities. Metropolitan renters tend to have better credit suggesting more financially stable renters, compared to rural counterparts. Selecting tenants with proven credit discipline, requiring co-signers, or rent guarantees for weaker profiles can reduce delinquency risk.
693.4

RANK
CREDIT SCORE RANGE
SEGMENT SIZE
Low
360-559
12.3%
Fair
560-639
14.2%
Good
640-699
20.5%
Great
700-759
24.6%
Excellent
760+
28.4%
city
CREDIT SCORe
yoy
Vancouver
731.1
Calgary
702.8
Winnipeg
654.8
Toronto
732.7
Montreal
688.2
Halifax
705.4
Canada has a favourable rental environment for property owners. Stronger tenant credit health means fewer payment issues, better tenant quality, less turnover, greater retention, and greater financial stability across rental portfolios.
Credit disparities by region suggest landlords in Winnipeg or the Prairies should tighten screening, personalize terms, and maintain financial buffers to offset higher tenant-risk variability.
This could indicate growing financial strain among residents despite high income levels, possibly tied to increased debt loads or cost-of-living pressures. If this trend continues, it may signal emerging credit risk in an otherwise financially stable market.
Although metropolitan cities are more expensive for tenants to afford, we see better quality tenants cluster within them across risk indicators such as collections rates, bankruptcy rates, and average credit scores. Property investors looking to expand their portfolios of income properties should plan strategically. Property prices may be lower in more rural areas, but tenant financial stability and risk increases in those areas as well.
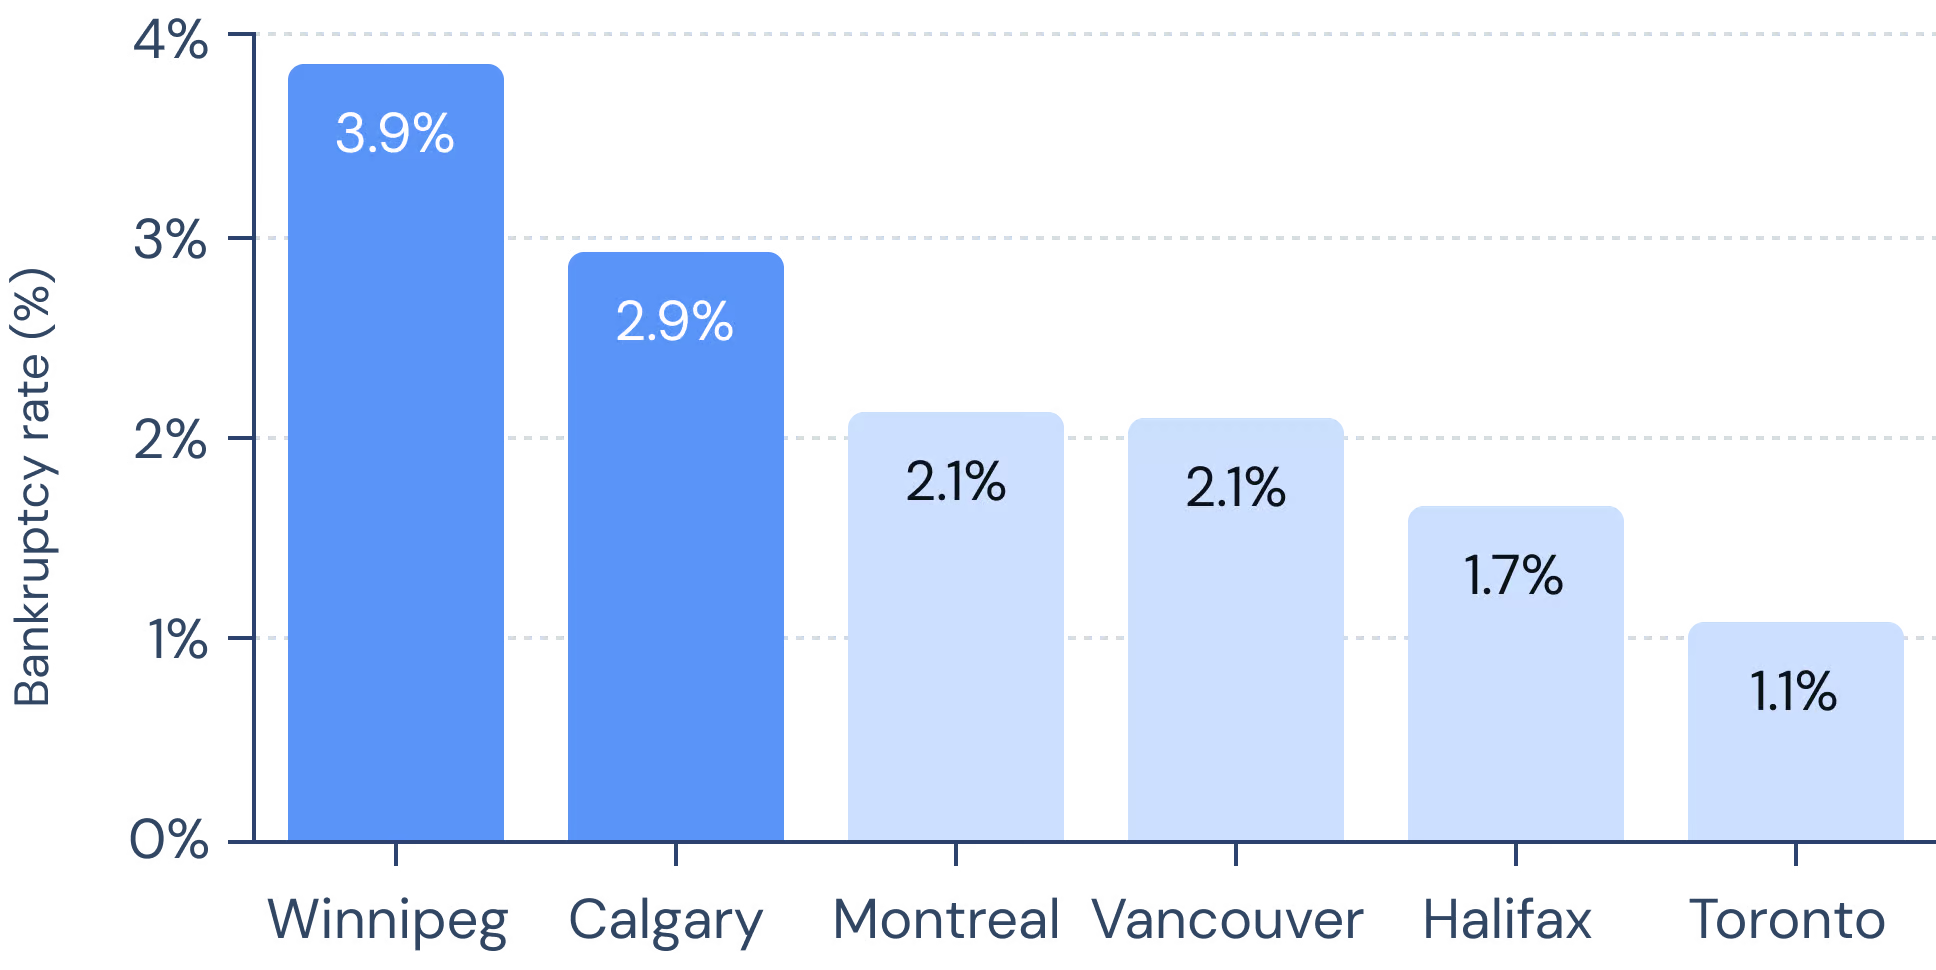
18.9%
3.9%
655
10.1%
2.9%
703
7.7%
2.1%
688
7.3%
2.1%
731
6.7%
1.7%
705
4.3%
1.1%
735
With the lowest delinquency and bankruptcy rates, and maintaining strong credit performance, these cities represent lower payment risk and higher tenant reliability, making them strong rental market opportunities for landlords.
Calgary’s rates indicate higher-than-average debt strain despite relatively solid credit scores, while Montreal’s slightly lower scores and moderate collections suggest income-to-debt imbalances among renters.
Nearly 1 in 5 tenants have accounts in collections and the highest bankruptcy rate among major cities. These trends, coupled with the city’s lower average credit score, suggest significant financial stress and a higher likelihood of missed or late rent payments.
We analyzed hundreds of thousands of rental applications and data points across Canada to determine the average renter profile, affordability, and risk signals throughout Q3 2025.
Median age
32
Average # of occupants
2
Households with pets
27%
Households with children
20%
Average monthly rent
$2,063
Monthly debt + rent payments
$2,708
Average personal income
$67,536
Average household income
$109,056
EMPLOYMENT TYPE
SEGMENT SIZE
Full-time
72.5%
Part-time
6.4%
Student
5.2%
Self-employed
4.7%
Other
4.3%
Unemployed
3.6%
Retired/Pension
3.4%
Canada’s renters have a median age of 33, are mostly full-time employed, and increasingly settled. About 12% have children and 28% have pets, reflecting a demographic renting later into life while starting families.
The average Canadian renter earns a personal income of $67K and a household income of $109K, yet faces rising costs. Rent alone consumes about one-third of earnings and total debt payments pushing overall financial strain near 40% of income.
Rent is more affordable in central Canada, however these renters have higher collection rates, bankruptcies, and lower credit scores, indicating higher financial instability.
Higher rent cost areas (Vancouver and Toronto) are less affordable, have fewer families as renters, and are young professional hubs. Lower rent cost areas (Winnipeg, Maritimes, Prairies) are more affordable and family-friendly. However, across the board renters are left with less than half of their pre-tax gross income to pay for bills, taxes, and cost of living, outside of their rent. This makes saving earnings difficult month to month. Renter demographics are aging. Renters are staying longer in their rentals and building families in them, further illuminating the unaffordable nature of home ownership across the country.
In Winnipeg, 21.4% of renters have children, and the city’s renters have the oldest median age in Canada (34.1). This indicates that Winnipeg offers greater affordability for renters seeking to start families.
The traditional model of "rent in 20s, buy before kids" is breaking down - renters are now in their mid-30s, and whether they have families depends more on regional affordability than age.
Rents are exceeding 30% of gross income across most of the country. Currently, Halifax and Montreal tenants face the most affordability strain, seeing lower incomes yet higher rent prices on average. Toronto and Vancouver appear less affordable overall, yet renters have higher incomes on average, which offsets higher rent costs.
Vancouver and Toronto continue to lead as Canada’s most expensive rental markets, while Quebec and the Prairies remain the last bastions of relative affordability.
Higher rents tend to coincide with older renter populations, while provinces with lower rents (like the Prairies and Quebec) see a higher share of households with children.
How to read this chart: The bar chart shows monthly expenses of rent, debt, and a renter’s income after these expenses are subtracted. The top line number shows the monthly gross household income before taxes. The purple line tracks the rent-to-income ratio, highlighting where housing costs take up more of renters’ pay.
Despite regional income differences, renters across Canada face similar affordability pressures. Rent consumes about one-third of household income, and when combined with debt, many households are left with limited disposable income.
How to read this chart: Bars show average rent by age group, with darker shades for older renters. The purple line represents the share of households with children, showing where family renters are most concentrated.
Affordability improves in dual-income households: rent’s share drops by nearly eight points when measured against household rather than personal income, allowing these renters to better absorb high rental costs.
How to read this chart: Each city shows rent as a share of personal income and household income. The gap between the two reflects how renting is more affordable on two incomes instead of one. All income is measured as gross monthly income before taxes.
While over half (53%) of renters earn under $60,000 annually, an increasing share fall into higher income brackets — with many earning well above $100,000. This shift points to a more affluent renter base overall, even as rent continues to consume roughly one-third of household income.
$67,536
$109,056
PERSONAL INCOME
RANGE
SEGMENT SIZE
28.4%
25.1%
19.2%
10.7%
8.1%
3.1%
5.5%
Province
AVG
RENT
MONTHLY INCOME
RTI
B.C
$2,490
$10,460
33.9%
Alberta
$1,869
$9,021
29.6%
Prairies
$1,683
$7,588
30.2%
Ontario
$2,159
$9,233
33.6%
Quebec
$1,623
$7,460
32.9%
Maritimes
$1,890
$8,230
32.6%
CITY
AVG
RENT
MONTHLY INCOME
RTI
Vancouver
$2,891
$12,183
35.6%
Calgary
$2,028
$9,699
27.7%
Winnipeg
$1,713
$8,975
26.0%
Toronto
$2,581
$11,862
30.6%
Montreal
$1,605
$7,479
32.3%
Halifax
$2,145
$9,371
34.2%
On average, renters fall in the good credit range, with a large share in great to excellent. Year over year, we are seeing credit strength improve over time across the provinces, while this trend is reversed in larger cities. Metropolitan renters tend to have better credit suggesting more financially stable renters, compared to rural counterparts. Selecting tenants with proven credit discipline, requiring co-signers, or rent guarantees for weaker profiles can reduce delinquency risk.
693.4
RANK
CREDIT SCORE RANGE
SEGMENT
SIZE
Low
360-559
12.3%
Fair
560-639
14.2%
Good
640-699
20.5%
Great
700-759
24.6%
Excellent
760+
28.4%
city
CREDIT SCORe
yoy
Vancouver
731.1
Calgary
702.8
Winnipeg
654.8
Toronto
732.7
Montreal
688.2
Halifax
705.4
Canada has a favourable rental environment for property owners. Stronger tenant credit health means fewer payment issues, better tenant quality, less turnover, greater retention, and greater financial stability across rental portfolios.
Credit disparities by region suggest landlords in Winnipeg or the Prairies should tighten screening, personalize terms, and maintain financial buffers to offset higher tenant-risk variability.
This could indicate growing financial strain among residents despite high income levels, possibly tied to increased debt loads or cost-of-living pressures. If this trend continues, it may signal emerging credit risk in an otherwise financially stable market.
Although metropolitan cities are more expensive for tenants to afford, we see better quality tenants cluster within them across risk indicators such as collections rates, bankruptcy rates, and average credit scores. Property investors looking to expand their portfolios of income properties should plan strategically. Property prices may be lower in more rural areas, but tenant financial stability and risk increases in those areas as well.
Collections
18.9%
Bankruptcies
3.9%
Credit score
655
Collections
10.1%
Bankruptcies
2.9%
Credit score
703
Collections
7.7%
Bankruptcies
2.1%
Credit score
688
Collections
7.3%
Bankruptcies
2.1%
Credit score
731
Collections
6.7%
Bankruptcies
1.7%
Credit score
705
Collections
4.3%
Bankruptcies
1.1%
Credit score
735
With the lowest delinquency and bankruptcy rates, and maintaining strong credit performance, these cities represent lower payment risk and higher tenant reliability, making them strong rental market opportunities for landlords.
Calgary’s rates indicate higher-than-average debt strain despite relatively solid credit scores, while Montreal’s slightly lower scores and moderate collections suggest income-to-debt imbalances among renters.
Nearly 1 in 5 tenants have accounts in collections and the highest bankruptcy rate among major cities. These trends, coupled with the city’s lower average credit score, suggest significant financial stress and a higher likelihood of missed or late rent payments.
We analyzed hundreds of thousands of rental applications and data points across Canada to determine the average renter profile, affordability, and risk signals throughout Q3 2025.
Median age
32
Average # of occupants
2
Households with pets
27%
Households with children
20%
Average monthly rent
$2,063
Monthly debt + rent payments
$2,708
Average personal income
$67,536
Average household income
$109,056
EMPLOYMENT
TYPE
SEGMENT
SIZE
Full-time
72.5%
Part-time
6.4%
Student
5.2%
Full-time
72.5%
Self-employed
4.7%
Other
4.3%
Unemployed
3.6%
Retired/Pension
3.4%
Canada’s renters have a median age of 32, are mostly full-time employed, and increasingly settled. About 12% have children and 28% have pets, reflecting a demographic renting later into life while starting families.
The average Canadian renter earns a personal income of $67K and a household income of $109K, yet faces rising costs. Rent alone consumes about one-third of earnings and total debt payments pushing overall financial strain near 40% of income.
Rent is more affordable in central Canada, however these renters have higher collection rates, bankruptcies, and lower credit scores, indicating higher financial instability.
Higher rent cost areas (Vancouver and Toronto) are less affordable, have fewer families as renters, and are young professional hubs. Lower rent cost areas (Winnipeg, Maritimes, Prairies) are more affordable and family-friendly. However, across the board renters are left with less than half of their pre-tax gross income to pay for bills, taxes, and cost of living, outside of their rent. This makes saving earnings difficult month to month. Renter demographics are aging. Renters are staying longer in their rentals and building families in them, further illuminating the unaffordable nature of home ownership across the country.
In Winnipeg, 21.4% of renters have children, and the city’s renters have the oldest median age in Canada (34.1). This indicates that Winnipeg offers greater affordability for renters seeking to start families.
The traditional model of "rent in 20s, buy before kids" is breaking down - renters are now in their mid-30s, and whether they have families depends more on regional affordability than age.
Rents are exceeding 30% of gross income across most of the country. Currently, Halifax and Montreal tenants face the most affordability strain, seeing lower incomes yet higher rent prices on average. Toronto and Vancouver appear less affordable overall, yet renters have higher incomes on average, which offsets higher rent costs.
Vancouver and Toronto continue to lead as Canada’s most expensive rental markets, while Quebec and the Prairies remain the last bastions of relative affordability.
Higher rents tend to coincide with older renter populations, while provinces with lower rents (like the Prairies and Quebec) see a higher share of households with children.
How to read this chart: Bars show average rent by age group, with darker shades for older renters. The purple line represents the share of households with children, showing where family renters are most concentrated.
Despite regional income differences, renters across Canada face similar affordability pressures. Rent consumes about one-third of household income, and when combined with debt, many households are left with limited disposable income.
How to read this chart: The bar chart shows monthly expenses of rent, debt, and a renter’s income after these expenses are subtracted. The top line number shows the monthly gross household income before taxes. The purple line tracks the rent-to-income ratio, highlighting where housing costs take up more of renters’ pay.
Affordability improves in dual-income households: rent’s share drops by nearly eight points when measured against household rather than personal income, allowing these renters to better absorb high rental costs.
How to read this chart: Each city shows rent as a share of personal income and household income. The gap between the two reflects how renting is more affordable on two incomes instead of one. All income is measured as gross monthly income before taxes.
While over half (53%) of renters earn under $60,000 annually, an increasing share fall into higher income brackets — with many earning well above $100,000. This shift points to a more affluent renter base overall, even as rent continues to consume roughly one-third of household income.
$67,536
$109,056
PERSONAL INCOME
RANGE
SEGMENT SIZE
28.4%
25.1%
19.2%
10.7%
8.1%
3.1%
5.5%
Province
AVG
RENT
MONTHLY INCOME
RTI
B.C
$2,490
$10,460
33.9%
Alberta
$1,869
$9,021
29.6%
Prairies
$1,683
$7,588
30.2%
Ontario
$2,159
$9,233
33.6%
Quebec
$1,623
$7,460
32.9%
Maritimes
$1,890
$8,230
32.6%
CITY
AVG
RENT
MONTHLY INCOME
RTI
Vancouver
$2,891
$12,183
35.6%
Calgary
$2,028
$9,699
27.7%
Winnipeg
$1,713
$8,975
26.0%
Toronto
$2,581
$11,862
30.6%
Montreal
$1,605
$7,479
32.3%
Halifax
$2,145
$9,371
34.2%
On average, renters fall in the good credit range, with a large share in great to excellent. Year over year, we are seeing credit strength improve over time across the provinces, while this trend is reversed in larger cities. Metropolitan renters tend to have better credit suggesting more financially stable renters, compared to rural counterparts. Selecting tenants with proven credit discipline, requiring co-signers, or rent guarantees for weaker profiles can reduce delinquency risk.
693.4
RANK
CREDIT SCORE RANGE
SEGMENT
SIZE
Low
360-559
12.3%
Fair
560-639
14.2%
Good
640-699
20.5%
Great
700-759
24.6%
Excellent
760+
28.4%
city
CREDIT SCORe
yoy
Vancouver
731.1
Calgary
702.8
Winnipeg
654.8
Toronto
732.7
Montreal
688.2
Halifax
705.4
Canada has a favourable rental environment for property owners. Stronger tenant credit health means fewer payment issues, better tenant quality, less turnover, greater retention, and greater financial stability across rental portfolios.
Credit disparities by region suggest landlords in Winnipeg or the Prairies should tighten screening, personalize terms, and maintain financial buffers to offset higher tenant-risk variability.
This could indicate growing financial strain among residents despite high income levels, possibly tied to increased debt loads or cost-of-living pressures. If this trend continues, it may signal emerging credit risk in an otherwise financially stable market.
Although metropolitan cities are more expensive for tenants to afford, we see better quality tenants cluster within them across risk indicators such as collections rates, bankruptcy rates, and average credit scores. Property investors looking to expand their portfolios of income properties should plan strategically. Property prices may be lower in more rural areas, but tenant financial stability and risk increases in those areas as well.
Collections
18.9%
Bankruptcies
3.9%
Credit score
655
Collections
10.1%
Bankruptcies
2.9%
Credit score
703
Collections
7.7%
Bankruptcies
2.1%
Credit score
688
Collections
7.3%
Bankruptcies
2.1%
Credit score
731
Collections
6.7%
Bankruptcies
1.7%
Credit score
705
Collections
4.3%
Bankruptcies
1.1%
Credit score
735
With the lowest delinquency and bankruptcy rates, and maintaining strong credit performance, these cities represent lower payment risk and higher tenant reliability, making them strong rental market opportunities for landlords.
Calgary’s rates indicate higher-than-average debt strain despite relatively solid credit scores, while Montreal’s slightly lower scores and moderate collections suggest income-to-debt imbalances among renters.
Nearly 1 in 5 tenants have accounts in collections and the highest bankruptcy rate among major cities. These trends, coupled with the city’s lower average credit score, suggest significant financial stress and a higher likelihood of missed or late rent payments.